Fig. 7.

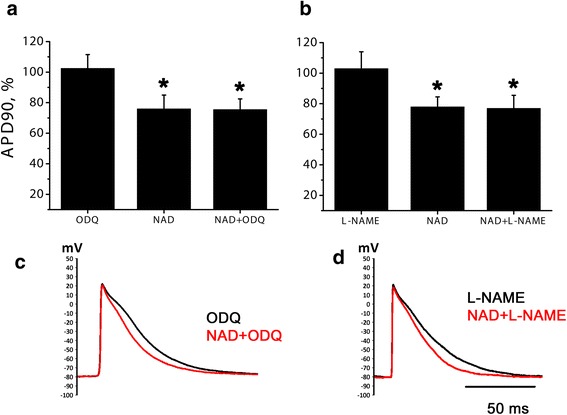
NAD + −induced AP shortening in the presence of NO signaling pathway blockers. a relative APD90 during the action of sGC inhibitor ODQ (5 μM) alone and at the moment of maximal AP shortening induced by 10 μM NAD+ in normal conditions and in the presence of ODQ. b relative APD90 during the action of NO-synthase inhibitor L-NAME (100 μM) alone and at the moment of maximal NAD+ effect in normal conditions and in the presence of L-NAME. APD90 is expressed in % of control APD90. * - significant difference from control, p < 0.05, Wilcoxon test. c, d representative traces of APs before and during NAD+ application in the presence of ODQ (c) or L-NAME (d)
