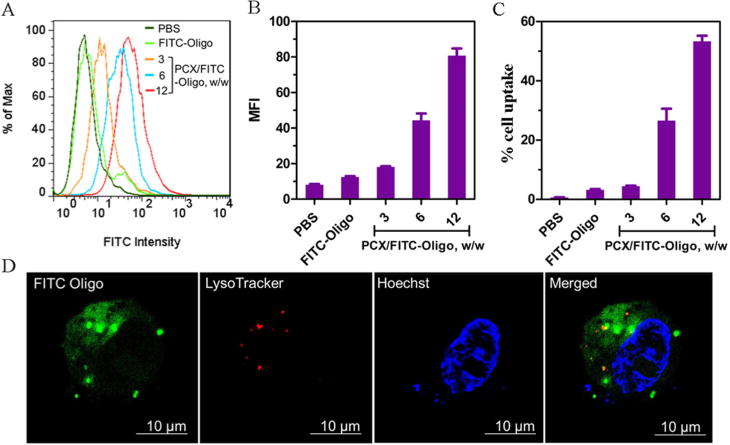
Figure 3.

Cellular uptake and intracellular trafficking of PCX polyplexes. (A) Overlayed histogram of flow cytometry analysis of cells treated with PCX/FITC-Oligo polyplexes at various w/w ratios (200 nM FITC-Oligo). Quantification of cellular uptake is shown by (B) mean fluorescence intensity (MFI) and (C) % cell uptake. Data are shown as mean ± SD (n = 3). (D) Intracellular trafficking of PCX/FITC-Oligo in HuCCT1 cells by CLSM after 4 h of incubation.
