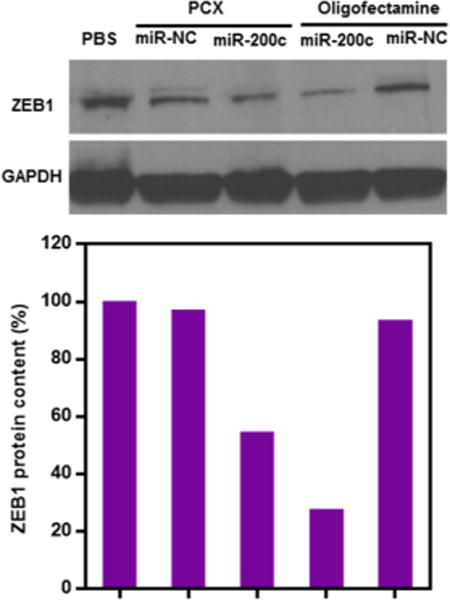
Figure 5.

Effect of miR-200c delivery on the expression of ZEB1 protein. Quantification of Western blot bands was performed using ImageJ software, and the data are expressed as relative ZEB1 levels relative to untreated cells (the order of samples corresponds to the gel above)
