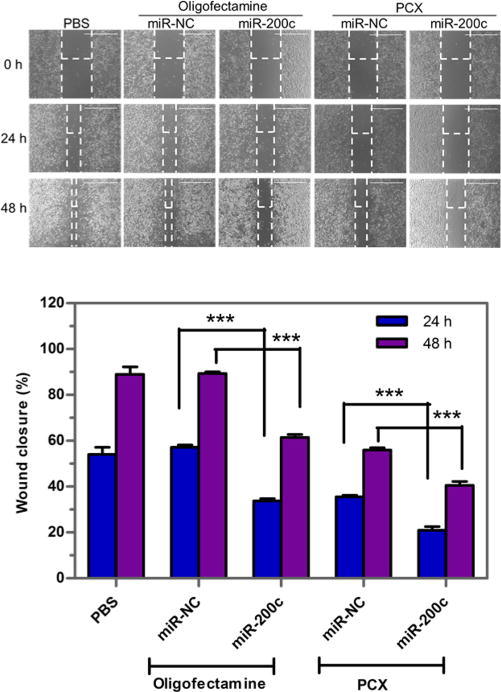
Figure 7.

Inhibition of wound healing. Cells were treated with formulations for 48 h. Then an artificial wound was created in the monolayer with a 1 mL pipet tip. The 4× imaging areas of the wounds were taken using a microscope at different time points. Wound closure was expressed as % initial wound size (mean ± SD; n = 3) (Scale bar = 1000 μm). Data are shown as mean ± SD (n = 3). ***, p < 0.001.
