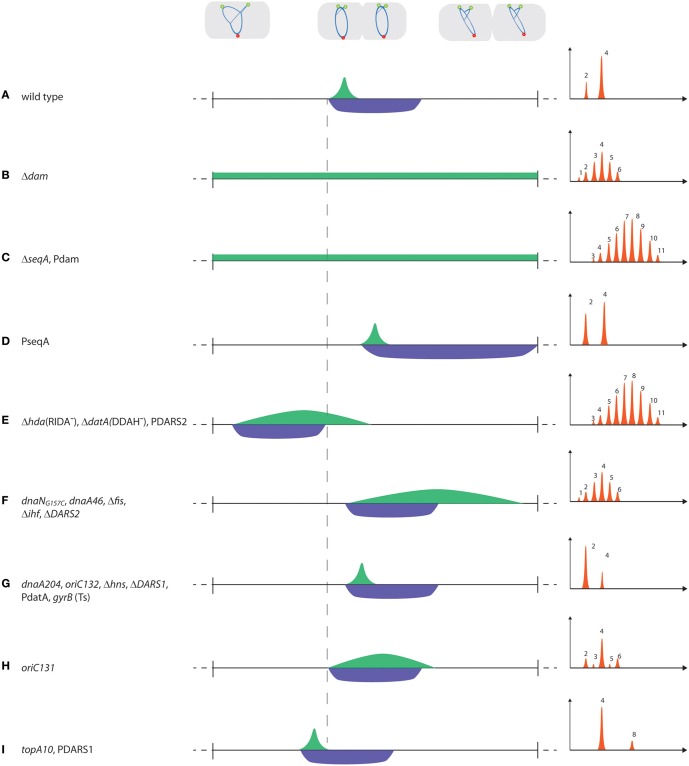
Figure 2.
Timing of replication initiation. Examples of mutants/plasmids with altered initiation (IP; green) and sequestration (SP; blue) periods. The horizontal line represents one doubling time, whereas the vertical (hyphenated) line illustrates the time of initiation of the first origin in wild-type cells. Note that the start of SP always coincides with the first origin initiated, i.e., start of IP. In the graphical representation of initiation synchrony, the number of origins per cell are on the X-axis, whereas the cell number is on the Y-axis of each histogram. When more than one mutation/plasmid is listed for a specific example (e.g., in C,E–G,I), the histograms are representative of the initiation phenotype of each individual mutation/plasmid.

