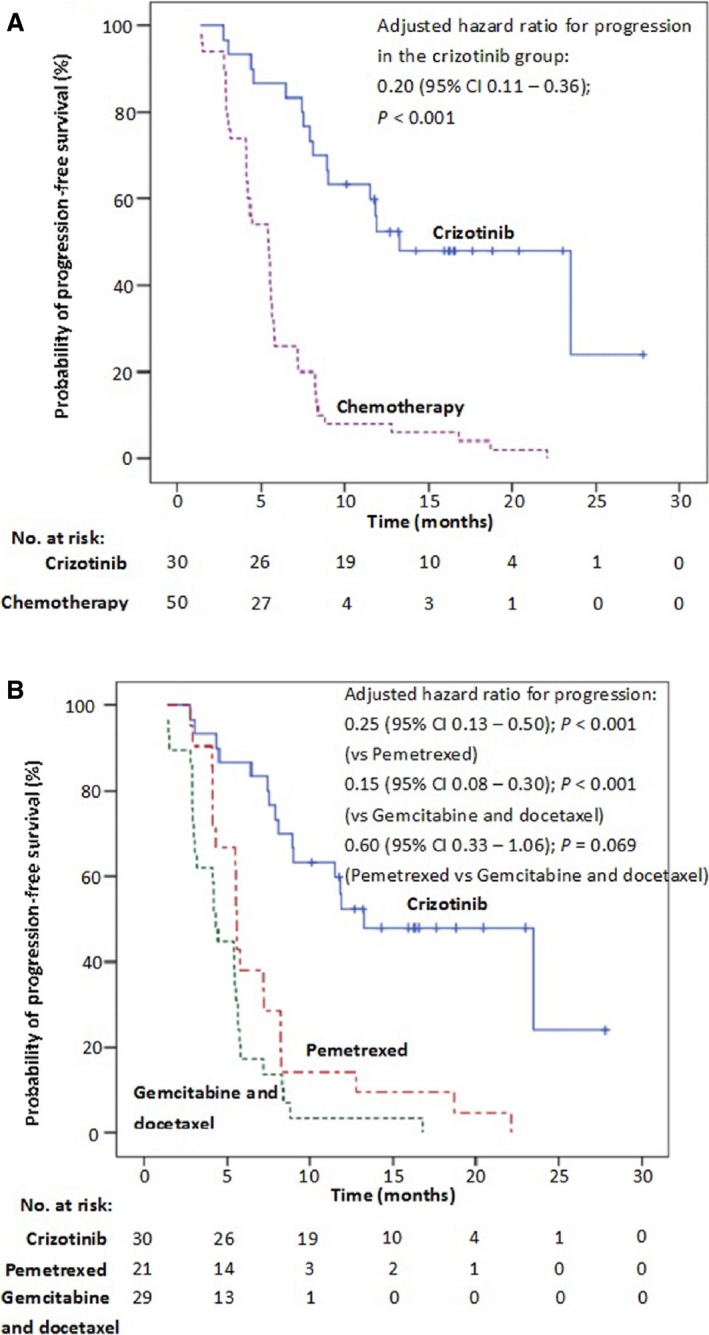
Figure 2.

(A) Kaplan–Meier curves of progression‐free survival (PFS) with first‐line crizotinib and first‐line standard chemotherapy (adjusted hazard ratio for progression or death in the crizotinib group, 0.20, 95% CI: 0.11–0.36; P < 0.001). (B) Kaplan–Meier curves of (PFS) with first‐line crizotinib and first‐line pemetrexed plus platinum and docetaxel or gemcitabine plus platinum chemotherapy regimens (adjusted hazard ratio for progression or death in the crizotinib group, 0.25, 95% CI: 0.13–0.50; P < 0.001 vs. pemetrexed; 0.15, 95% CI: 0.08–0.30; P < 0.001 vs. gemcitabine and docetaxel; 0.60, 95% CI: 0.33–1.06; P = 0.069 pemetrexed vs. gemcitabine and docetaxel). Tick marks represent censored observations.
