FIG. 3.
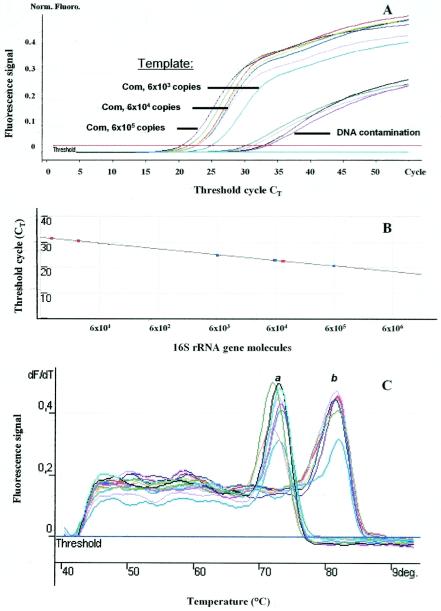
Insufficient quantification of bacterial 16S rRNA genes from sample G6 (depth, 120 m) by real-time PCR (without preamplification). (A) Environmental DNA was used as the template in quantities of 6.1 × 10⁵ to 6.1 × 10² bacterial chromosomes for the Com primer set, representing CT values ranging from 20.6.0 to 25.1. Specific PCR products did not appear when environmental DNA was used as the template for the OST primer set. DNA contamination represented CT values ranging from 30.4 to 33.6. Norm. Fluoro., normalized fluorescence. (B) Relation between the CT and the apparent amount of 16S rRNA gene molecules by SybrGreen real-time PCR. Each point represents an amount of 16S rRNA gene molecules corresponding to the CT value with the Com primer set. Values for standard molecules are represented as blue points, and those for samples are shown as red points. The correlation coefficient of the regression line was 0.999. PCR efficiency was 1.78. (C) Melting-curve analysis of online PCR signals. Peak a shows DNA contaminants melting at 72.0 to 73.0°C; peak b shows Com products melting at 81.5 to 82.0°C. deg., degrees.

