
Figure 2.
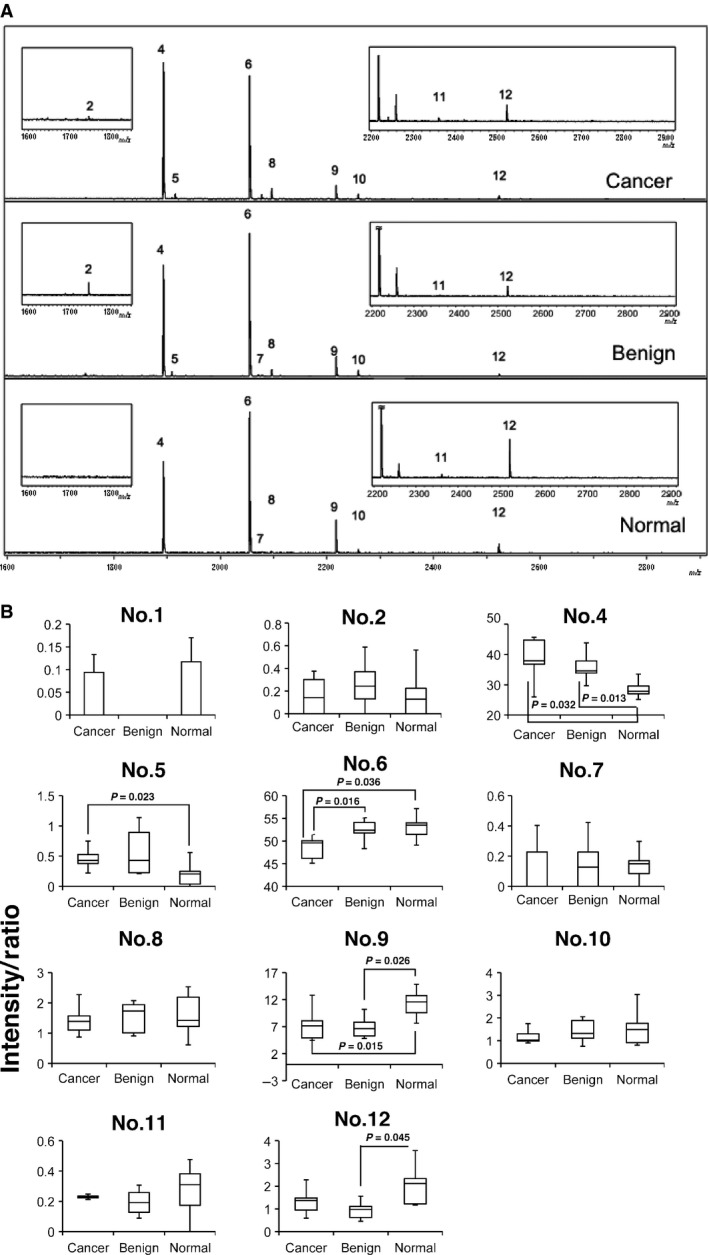
Quantification of N‐linked glycans associated with serum IgG heavy chains from patients with prostate cancer, patients with benign prostatic diseases, and normal healthy subjects. (A). MALDI‐TOF mass spectra showing N‐glycan profiles of serum IgG from patient with prostate cancer (Cancer), patient with benign prostatic disease (Benign), and normal healthy subject (Normal). The data shown are representative of five separate experiments in each experimental group. (B). Quantitative analysis of MALDI‐TOF mass spectra. Quantification was performed with separated 12 peaks (n = 5). Note that two glycans, No. 4 and No. 6, which were consistently found associated with IgG heavy chains, correspond to [(HexNAc)2(Deoxyhexose)1 + (Man)3(GlcNAc)2] and [(Hex)1(HexNAc)2(Deoxyhexose)1 + (Man)3(GlcNAc)2], respectively. Although peaks 1, 3, and 13 were detected mechanically, their content (intensity) was too small to quantify. The intensity/ratio as described in reference 17 was calculated for each experimental group.