Figure 3.

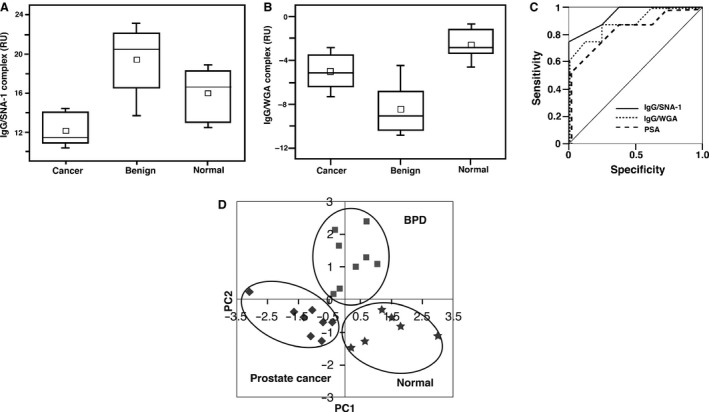
The distribution of the amount of IgG bound with SNA‐1 (A) or wheat germ hemagglutinin (WGA) (B) in the sera of patients, as measured by surface plasmon resonance (SPR) analysis. The small open square represents an average. The horizontal line in the box represents the median value. In the case of IgG bound with SNA‐1 (A), there was a significant difference between the prostate cancer group and the control or BPD (benign prostatic disease) groups with P values of 0.0002 and 0.016, respectively (n = 12 for prostate cancer group, n = 13 for BPD group, n = 7 for normal control subjects). In the case of IgG bound with WGA (B), the mean RU of the cancer group was significantly larger than that of BPD (benign prostatic disease) with a P value of 0.03, but smaller than that of normal subjects with a P value of 0.003 (n = 9 for prostate cancer group, n = 9 for BPD group, n = 7 for normal control group). From the ROC curve (C), the area under the curve (AUC) value was 0.95 for IgG/SNA‐1, represented as a solid line, and was 0.88 for IgG/WGA, represented as a dotted line. Meanwhile, the AUC value for prostate‐specific antigen (PSA), a conventional diagnostic marker, represented as a broken line, was 0.84. The results of the principal components analysis (PCA) were plotted (D). The symbols represent the following: the diamond; prostate cancer patients (n = 8), the square; benign prostatic disease (BPD) patients (n = 8), the star; the normal subjects (n = 6). The four elements consisting of IgG‐SNA‐1, IgG‐WGA, haptglobin‐SNA‐1 and PSA clearly segregate the cancer patients, the BPD patients, and the normal subjects.
