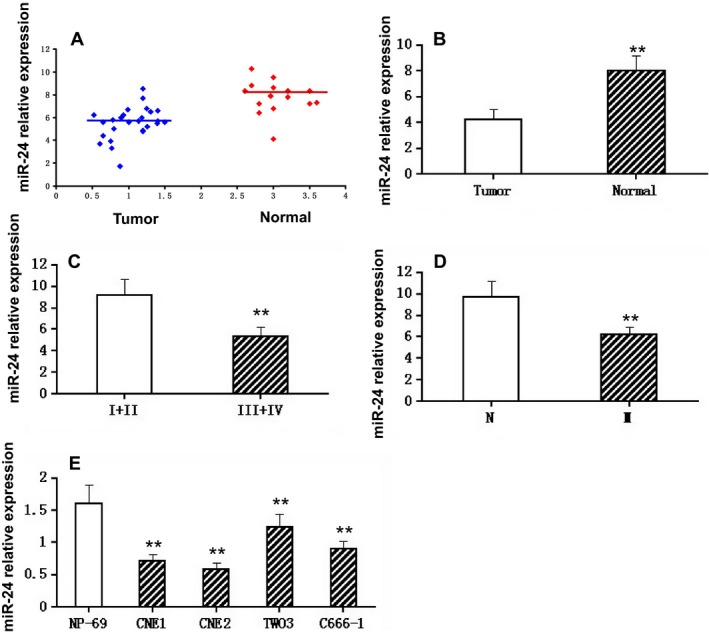
Figure 1.

Expression of miR‐24 in various tissues or cell lines. (A). Relative expression of miR‐24 in non‐tumor tissues (n = 12) and NPC tissues (n = 42). RT‐PCR was used to determine the expression of miR‐24, which was normalized to U6 expression to obtain relative expression. N, non‐tumor tissues; T, tumor tissues. (B). Histograms of the average relative expression of miR‐24 in non‐tumor tissues (n = 12) and NPC tissues (n = 42). Data are means ±SD. Asterisks indicate values that are significantly different from the values of non‐tumor tissues (P < 0.01). (C). Histograms of the average relative expression of miR‐24 in patients at stages I+II and III+IV. Data are means ±SD. Asterisks indicate values that are significantly different from the values of patients at stage I+II (P < 0.01). (D). Histograms of the average relative expression of miR‐24 in patients without and with lymph node metastasis. Data are means ±SD. Asterisks indicate values that are significantly different from the values of patients without lymph node metastasis (P < 0.01). M, lymph node metastasis. (E). Histograms of the average relative expression of miR‐24 in normal nasopharyngeal epithelial cell line (NP‐69) and NPC cell lines (CNE1, CNE2, TWO3, and C666‐1). Data are means ±SD. Asterisks indicate values that are significantly different from the values of NP‐69 (P < 0.01).
