Figure 3.

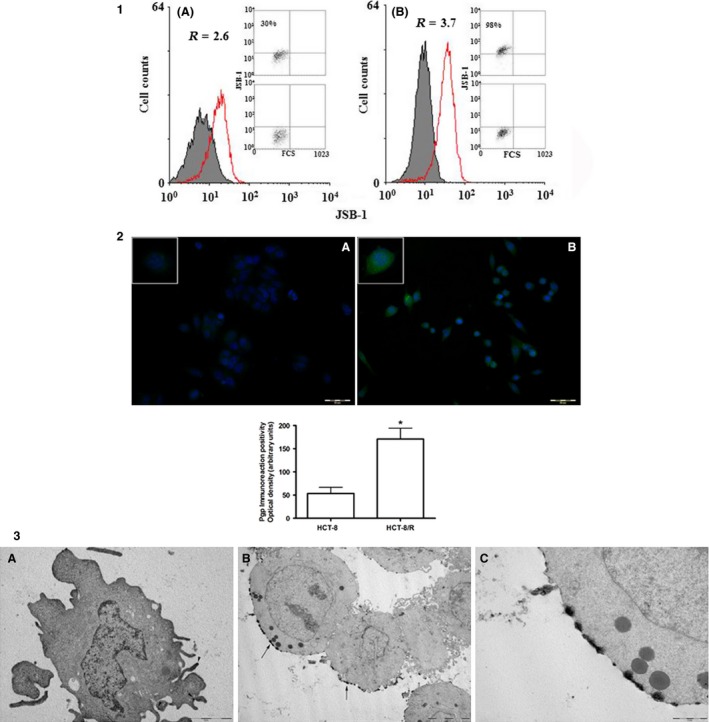
Panel 1 shows the expression of the Pgp MDR‐1 gene product in HCT‐8 (A) and HCT‐8/R (B) cells. R = ratio between MFI of treated sample and isotype control Percentage of cells staining was also reported. Panel 2: immunocytochemistry of immunostained cells with anti‐Pgp antibody. The upper panel shows the immunoreaction positivity in HCT‐8 (panel A) and HCT‐8/R (panel B). Inserts show higher magnification of illustrative cells in which is possible to evaluate the intensity and distribution of immunolabeling. The quantitative results of densitometry are given in the graph below. *P < 0.05 (ten microscopic fields analyzed with an average of 100 cells; total number of analyzed cells: 1000) Panel 3: immunoelectron micrographs of HCT‐8 immunostained with anti‐Pgp antibody. Panel A: HCT‐8, immunoreaction positivity is visible only in a few portions of cytoplasmic membrane (black arrow heads), ×15,000. Panel B: HCT‐8/R, immunoreaction positivity appears intense and distributed in large parts of the cytoplasmic membrane, ×5000. Panel C: higher magnification of panel B, ×20,000.
