Figure 4.

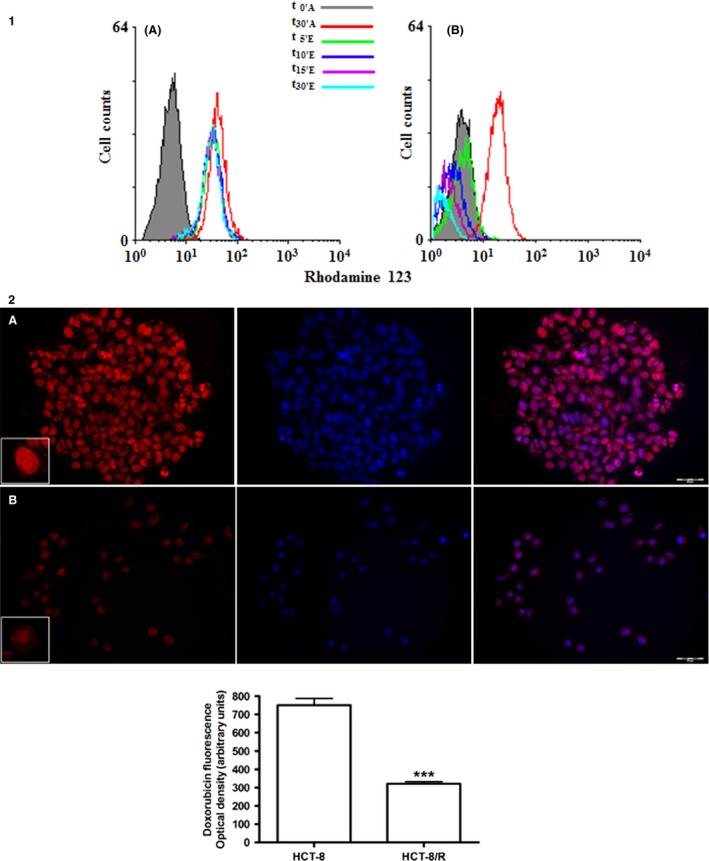
Panel 1 shows flow cytometry histograms of the intracellular rhodamine‐123 accumulation and efflux: (A) parental HCT‐8 cell line; (B) resistant HCT‐8 subline. Panel 2: doxorubicin uptake and distribution evaluated by autofluorescence. The upper panel shows doxorubicin presence and distribution in HCT‐8 (A) and HCT‐8/R (B). The first image of each row shows the doxorubicin autofluorescence, the central image shows DAPI staining and the third images shows the merge. The quantitative results are given in the graph below. ***P < 0.001 (ten microscopic fields analyzed with an average of 100 cells; total number of analyzed cells: 1000).
