Figure 4.
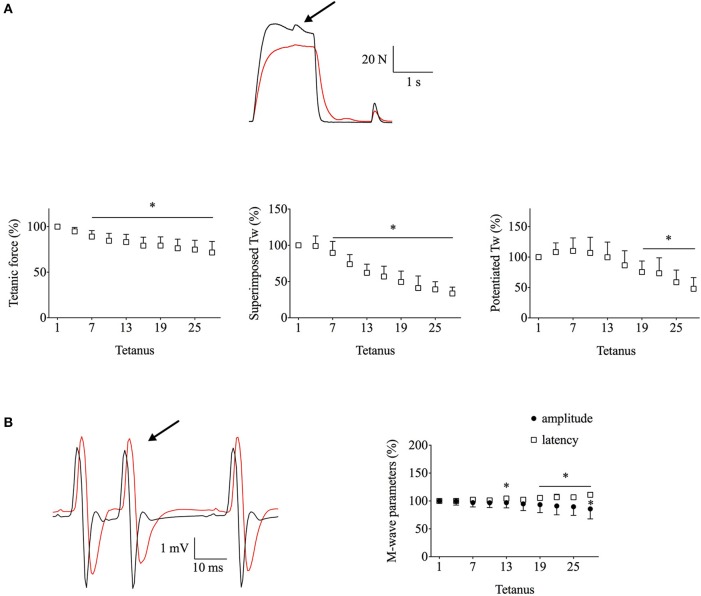
Superimposed twitch (Tw) force was still markedly decreased in Exp3, which combined the less intense stimulation with ischemia and decreased stimulation frequency during contractions. Human adductor pollicis muscles were stimulated at 20 Hz, 1.5 s on–3 s off. (A), the upper part shows representative force records of the first and last fatiguing contractions and the lower part mean data of tetanic and peak twitch forces; expanded superimposed twitches are shown above the tetanic force records. (B), EMG records (left) and mean M-wave amplitude and latency (right). Black and red lines in original records correspond to the first and the last tetanus; respectively; arrow indicates the extra stimulation. Data are mean ± SD expressed in percentage of the initial value (n = 7). *p < 0.05 shows significant difference from the first tetanus (one-way repeated measures ANOVA).

