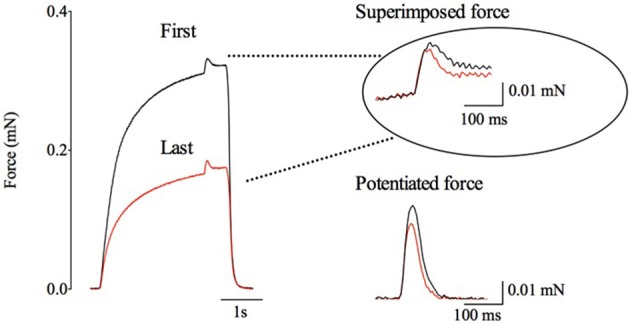
Figure 5.

Typical force records illustrating the relatively small changes in superimposed and potentiated twitch forces in fatigued rat soleus fibers despite a marked reduction in tetanic force. Black and red lines correspond to the first and last fatiguing contraction, respectively. Right part shows twitches on an expanded scale. Dotted lines point to the time during the tetanus when the superimposed twitch was elicited.
