
Figure 3.
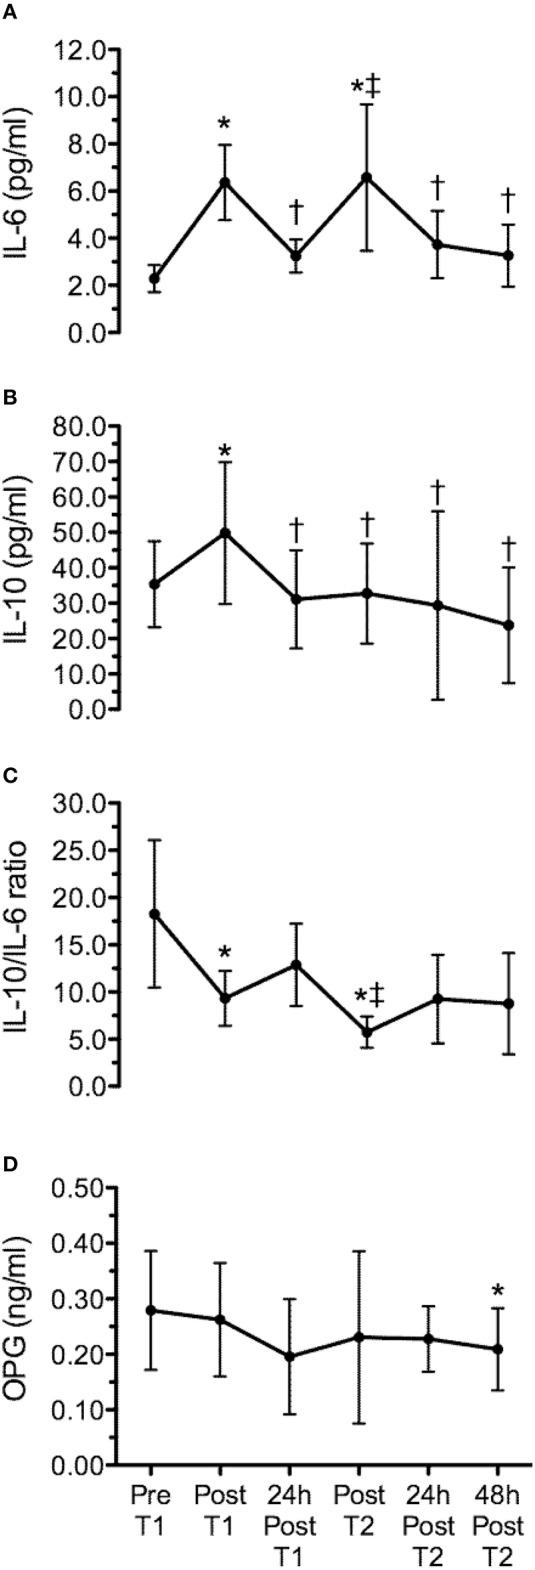
Time line of interleukin-6 (IL-6) (A), interleukin-10 (IL-10) (B), IL-10/IL-6 ratio (C) and osteoprotegerin (OPG) (D), corresponding to pre (Pre T1) and post workout of the day 1 (Post T1), 24 h after workout of the day 1 (24 h post T1), post workout of the day 2 (Post T2), 24 h (24 h post T2) and 48 h (48 h post T2) after workout of the day 2. Values are expressed as means ± SD. *p < 0.05 comparing to Pre T1; †p < 0.05 comparing to Post T1; ‡p < 0.05 comparing to 24 h Post T1.