
Figure 5.
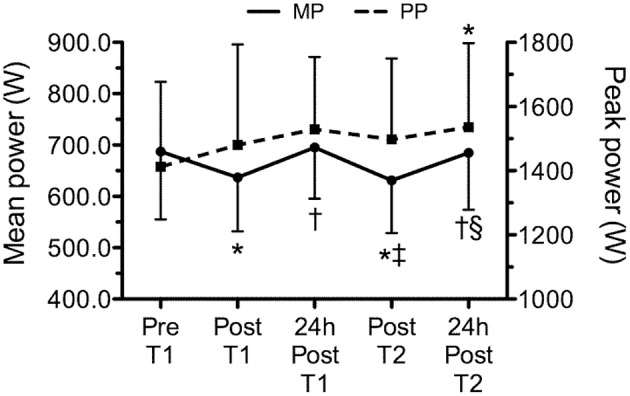
Time line of mean and peak power, corresponding to pre (Pre T1) and post training session 1 (Post T1), 24 h after workout of the day 1 (24 h post T1), post workout of the day 2 (Post T2) and 24 h after workout of the day 2 (24 h post T2). Values are expressed as means ± SD. *p ≤ 0.05 to Pre T1; †p ≤ 0.05 to Post T1; ‡p ≤ 0.05 to 24 h Post T1; §p ≤ 0.05 to Post T2.