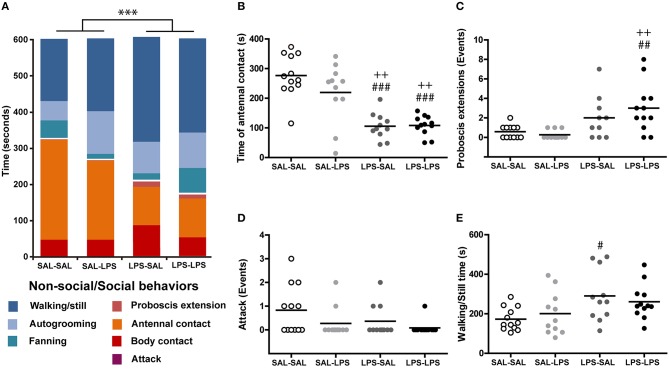
Figure 5.
LPS decreases social interaction between bees. (A) Ethogram of bees in the different treatment groups shown as fractions of time spent in different behaviors. Blue fractions correspond to non-social behaviors while red-orange fractions correspond to the social behaviors indicated in the figure. Total time spent in attacks is indistinguishable at this time scale. (B) Time spent in antennal contact by each animal in the different groups. Events of (C) proboscis extension and (D) attacks carried out by each animal in each group. (E) Time spent in walking or being still by each animal in each group. N, SAL-SAL = 12, SAL-LPS = 11, LPS-SAL = 11, LPS-LPS = 12, except for LPS-SAL group in graph (C) where N = 10. Each circle stands for a single animal. Horizontal bars represent the mean of the group. Two-way repeated measures ANOVA ***p < 0.001. Post-hoc Tukey test comparisons against SAL-SAL group, #p < 0.05, ##p < 0.01, ###p < 0.001; comparisons against SAL-LPS group (++) p < 0.01.

