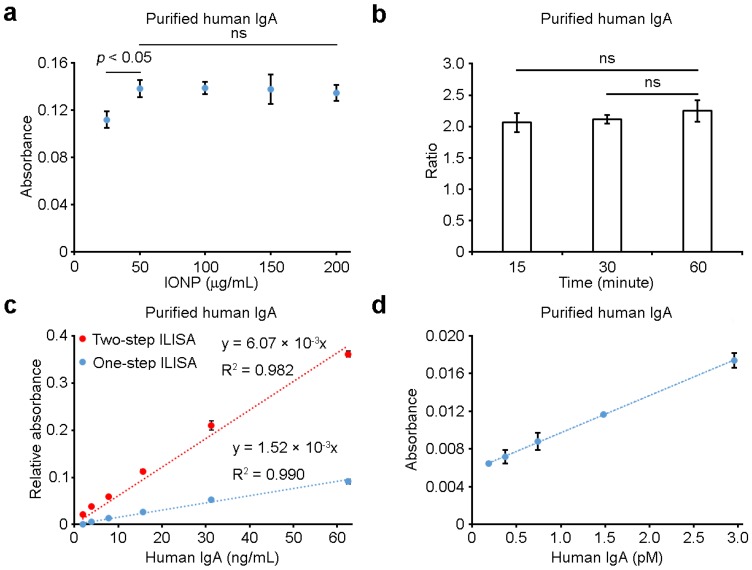
Figure 2.
The reliability and sensitivity of sandwich ILISA. (a) The effects of probe concentrations on ILISA measurements. (b) The effects of incubation time on ILISA measurements. Y-axis indicates the ratio of absorbance measurements with IgA concentration of 500 ng/mL and 125 ng/mL respectively. (c) Detection sensitivity was further increased with a two-step sandwich ILISA. Shown is the measured absorbance as a function of IgA concentration using the two-step and one-step ILISA assays respectively. The ratio of the slopes of the two curves (6.07 and 1.52 respectively) indicates the average number of secondary IONP probes bound to each primary probe. (d) IgA was quantified with a two-step sandwich ILISA, demonstrating high detection sensitivity. Data represent means ± SD of three measurements.

