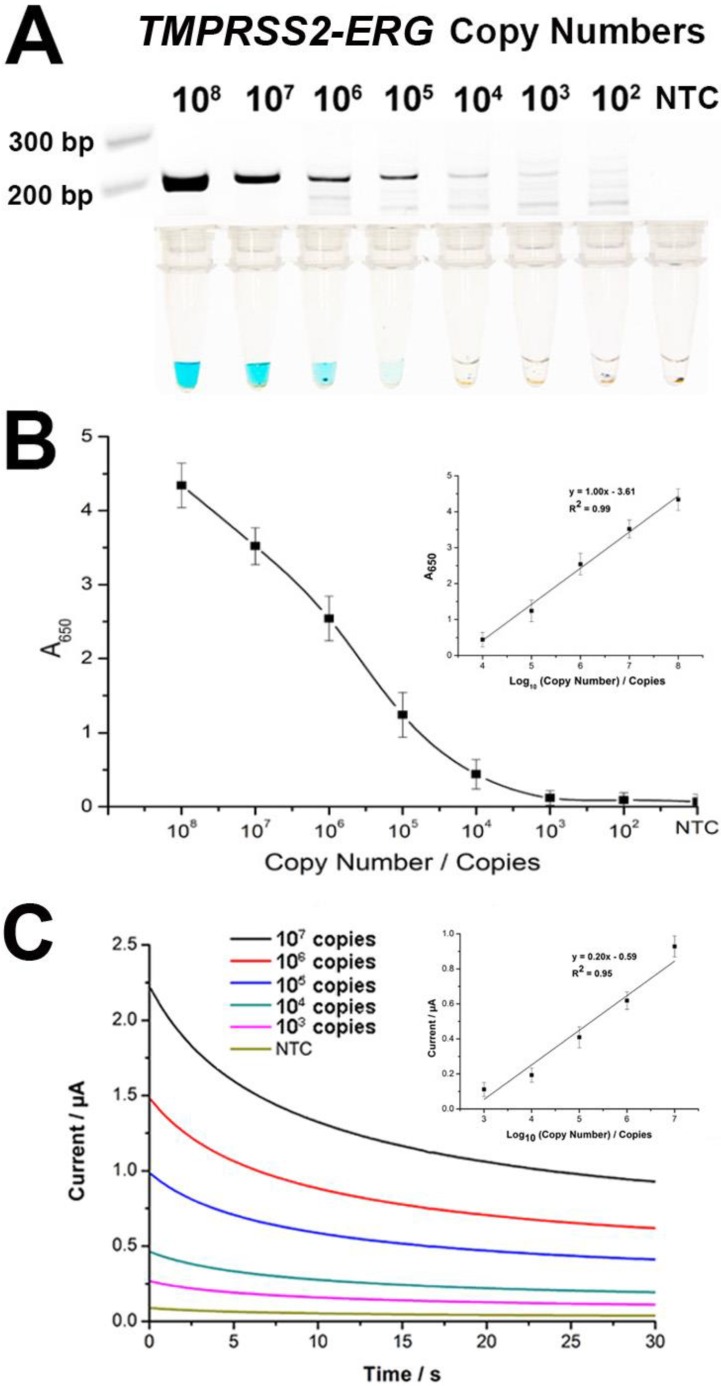
Figure 3.
Sensitivity of FusBLU assay. (A) HRP-catalyzed colorimetric change generated from 102 - 108 copies of synthetic TMPRSS2-ERG mRNA, and corresponding gel electrophoresis images after RT-RPA. (B) Calibration plot of the average absorbance measurements at different initial RT-RPA input amounts. Inset shows the analogous linear calibration plot. (C) HRP-catalyzed current change generated from 103 - 107 copies of synthetic TMPRSS2-ERG mRNA. Inset shows the analogous linear calibration plot. Error bars represent standard deviation of three independent experiments.

