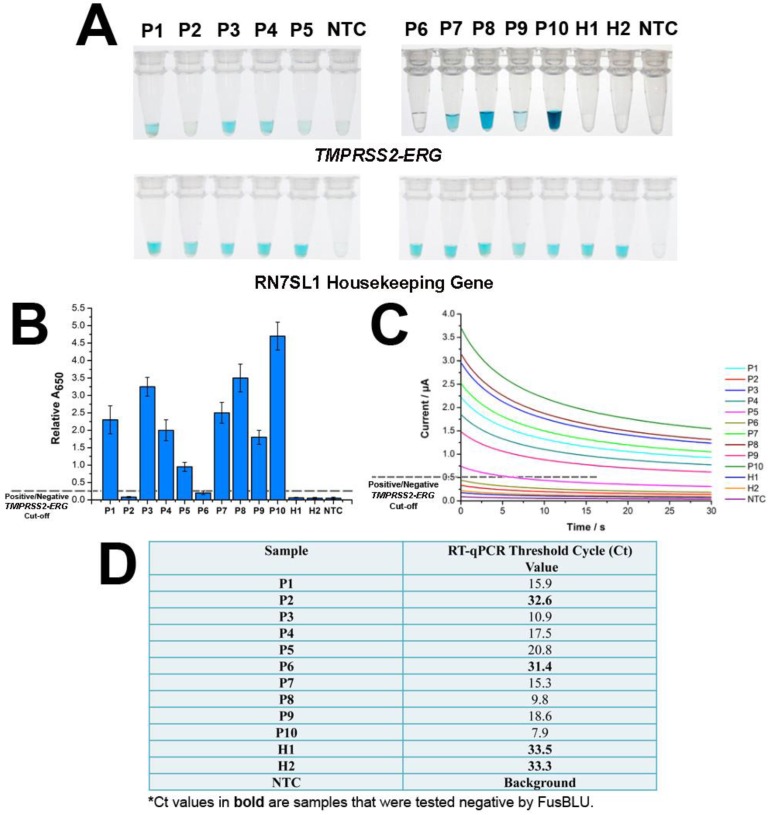
Figure 4.
FusBlu assay on clinical urinary samples. (A) HRP-catalyzed colorimetric results of 12 urinary samples over two different assay runs (1st run (Left): P1-P5; 2nd run (Right): P6-H2). Top panel: TMPRSS2-ERG. Bottom panel: RN7SL1. (B) TMPRSS2-ERG levels normalized to RN7SL1. (C) TMB-derived currents of 12 urinary samples compared to no template-control (NTC). (D) RT-qPCR threshold cycle (Ct) values for each sample as validation for FusBLU results. Error bars represent standard deviation of three independent experiments.

