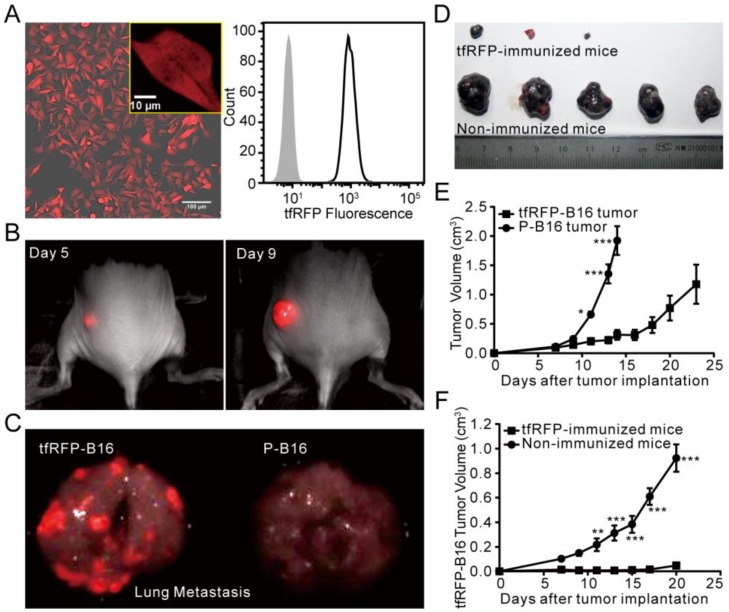
Figure 1.
The tumorigenicity of tfRFP-B16 cells. (A) Confocal microscopy and flow cytometry analysis of tfRFP-B16 cells. Bar in the lower right of the merged image represents 100 μm; the bar in the enlarged box in the upper right represents 10 μm. (B) Whole-body fluorescence imaging of a tfRFP-B16 tumor-bearing mouse. (C) Metastatic potential of tfRFP-B16 cells and the fluorescence imaging of metastases. (D) Photographs of tfRFP-B16 and P-B16 cells in the tfRFP-immunized and non-immunized mice. (E) Tumor growth of tfRFP-B16 and P-B16 cells in normal C57BL/6 mice. (F) Tumor growth of tfRFP-B16 cells in the tfRFP-immunized and non-immunized C57BL/6 mice. Statistical analyses were performed using two-way ANOVA analysis and Bonferroni post-tests. For the experiments in D and E, n = 5, error bars represent the means ± SEM, *P < 0.05, **P < 0.01, ***P < 0.001.

