Figure 4.
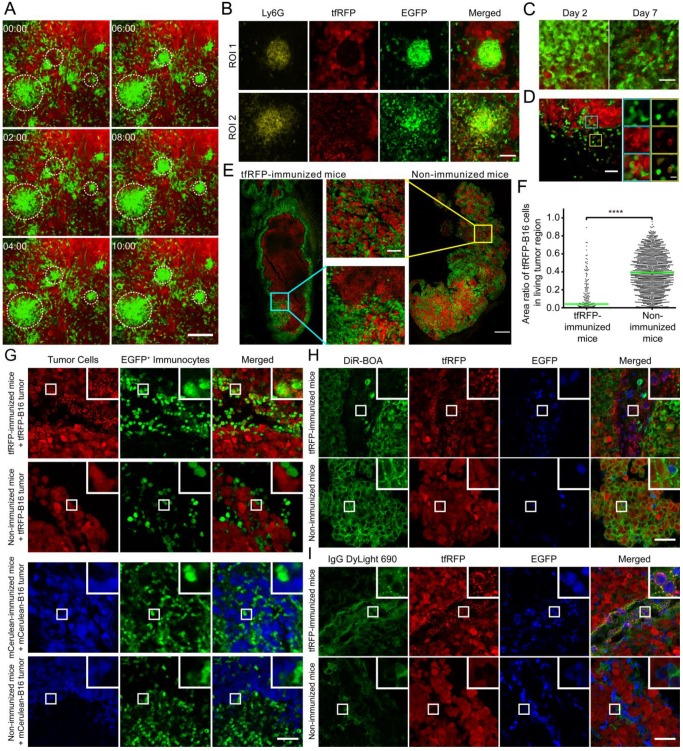
The formation of immunocyte clusters and the generation of tfRFP+ microparticles in tumor microenvironment of tfRFP-immunized mice. (A) Cell clusters formed on Day 2 in tfRFP-immunized mice as shown in Additional file 4: Video S3. The scale bar represents 100 μm. (B) Representative cryosection images of the newly formed (ROI 1, cyan box in Fig. S7) and disassociating (ROI 2, yellow box in Fig. S7) Ly-6G+ neutrophil clusters on Day 2. The scale bar represents 50 μm. (C) Representative images of tfRFP+ microparticles in tfRFP-immunized mice on Day 2 and Day 7. The scale bar represents 25 μm in length and approximately 2 μm in height. (D) tfRFP+ immunocytes appeared on Day 2 at the tumor border in the tfRFP-immunized mice. The typical FOV is indicated by the white box in Fig. S7. The enlarged images at the right side show the details of the corresponding boxes. The scale bar in the large image represents 50 μm, and the bar in the enlarged image is 10 μm. (E) tfRFP immunization led to the elimination of tfRFP-B16 cells in tfRFP-B16/mCerulean-B16 mixed tumors, leaving only the tfRFP+ microparticles. Red: tfRFP-B16 cells; Green: mCerulean-B16 cells. The scale bar represents 500 μm. Enlarged images are detailed images of the corresponding boxes from tfRFP-immunized mice and non-immunized mice. The scale bar represents 100 μm. (F) Statistical comparison of area ratio of tfRFP-B16 in living mixed tumor area. The data were pooled from 2 mice in each group. Each point stands for an area of 100 μm × 100 μm. (G) The phenomenon of generating microparticles is specific to tfRFP immunization but not mCerulean immunization. Day 2 tumors from the indicated mice were separated and sectioned for fluorescence imaging. The images are representative of those from 3 mice in each group. The scale bar represents 50 μm. (H, I) tfRFP+ microparticles were DiR-BOA- and IgG+. Cryosections of Day 2 tfRFP-B16 tumors from both immunized and non-immunized mice were stained with DiR-BOA (H) and anti-mouse IgG DyLight 690 (I). The results are typical images of Day 2 tumor sections from 3 mice in each group. The box in the upper right corner of each image shows the 3× enlarged details of the corresponding smaller white boxes. The scale bar represents 50 μm.

