Figure 5.
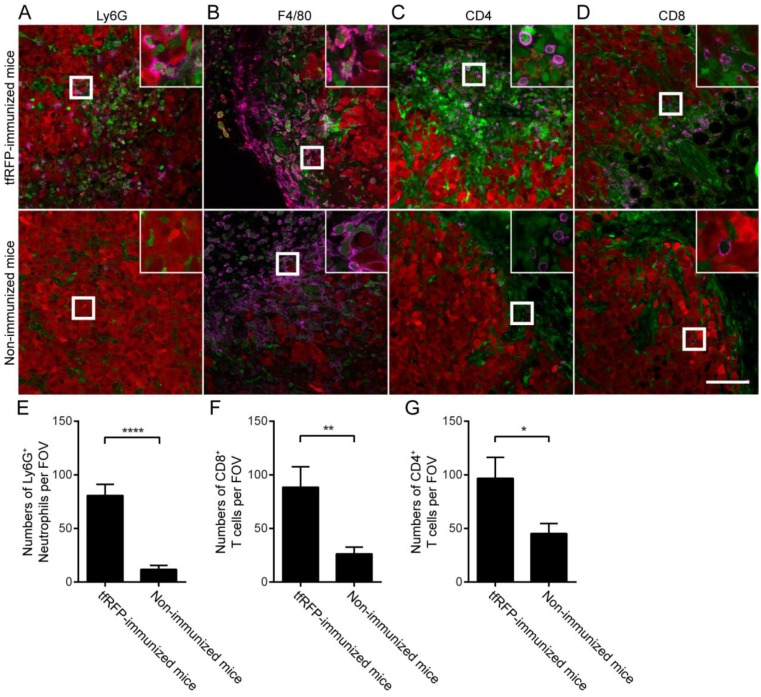
Identification of tumor-infiltrating immunocytes in a tfRFP+ tumor on Day 7 with an immunofluorescence assay. (A) Ly6G+ neutrophils infiltrated to a greater extent in the tfRFP-immunized mice than in the non-immunized mice. The occurrence of tfRFP+ microparticles was related to the distribution of Ly6G+ neutrophils. (B) tfRFP+ macrophages (F4/80+, see Fig. S10 in the supplementary material for more details) were present in the tumor microenvironment only in the tfRFP-immunized mice. The data shown are representative images of tfRFP+ macrophages on Day 7. (C, D) A greater number of both CD4+ and CD8+ T cells accumulated in the tumor margin in the tfRFP-immunized mice than in the non-immunized mice. The size of the field of view (FOV) is 425.10 μm × 425.10 μm. The scale bar represents 100 μm. Images are representative of 2-4 mice in each group. Green cells are EGFP+ host immunocytes and red cells are tfRFP-B16 tumor cells. The magenta color represents the fluorescence signal of antibodies against the indicated antigens (see Fig. S10 for images of single channels). The numbers of Ly6G+ cells (E), CD8+ T cells (F) and CD4+ T cells (G) per FOV were statistically analyzed with Student's t-test. The data are pooled from at least 10 FOVs in each group and are shown as the means ± SEM. P values less than 0.05 were considered to be statistically significant (*P < 0.05, **P < 0.01, ****P < 0.0001).

