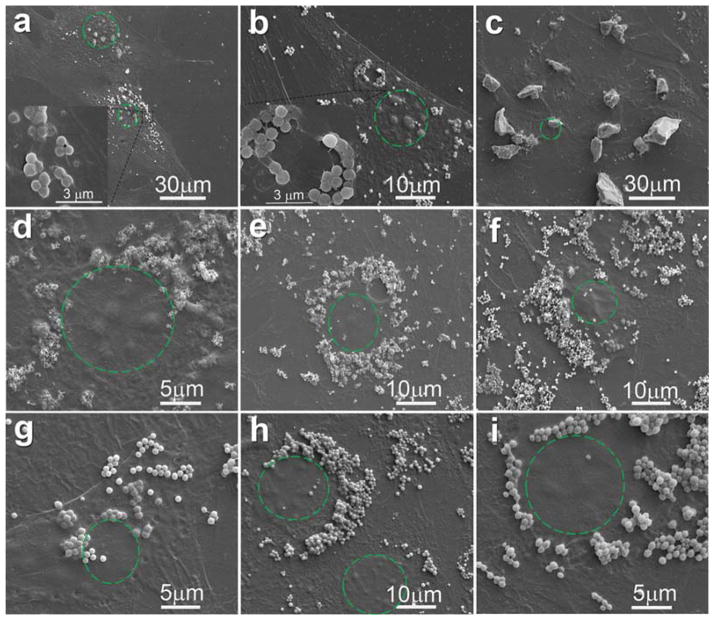
Figure 10.
SEM images showing the uptake of NMBGs at the concentration of 50 μg/mL ((a) Group-327 nm, (b) Group-743 nm, (c) Group-77 S) and at the concentration of 150 μg/mL ((d) Group-174 nm, (e) Group-484 nm, (f) Group-647 nm, (g) Group-743 nm, (h) Group-990 nm, (i) Group-1085 nm) after in vitro culture for 24 h. The green dotted circles indicate the position of cell nucleus.

