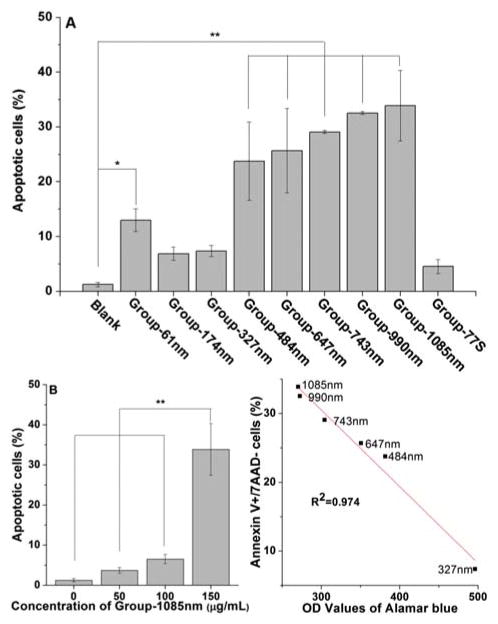
Figure 9.
Apoptosis ratio in MC3T3-E1 cells induced by NMBGs. (A) Cells were cultured with NMBGs at the concentration of 150 μg/mL for 24 h and detected by flow cytometry. Bar graphs represent the percentage of AnnexinV+/7AAD-cells. All data in bar graph A are depicted as mean±SD, with *p < 0.05 and **p < 0.001 versus controls. (B) cells were incubated with Group-1085 nm at the concentrations of 50, 100, and 150 μg/mL for 24 h. **p < 0.001, 150 μg/mL compared to the control, 50 μg/mL and 100 μg/mL of 1085 nm-NMBG (n = 3). (C) Correlation between the apoptosis and Alamar blue in Groups of 327 nm to 1085 nm at 150 μg/mL, which was generated from data shown in Figures 3(C) and 9(A).

