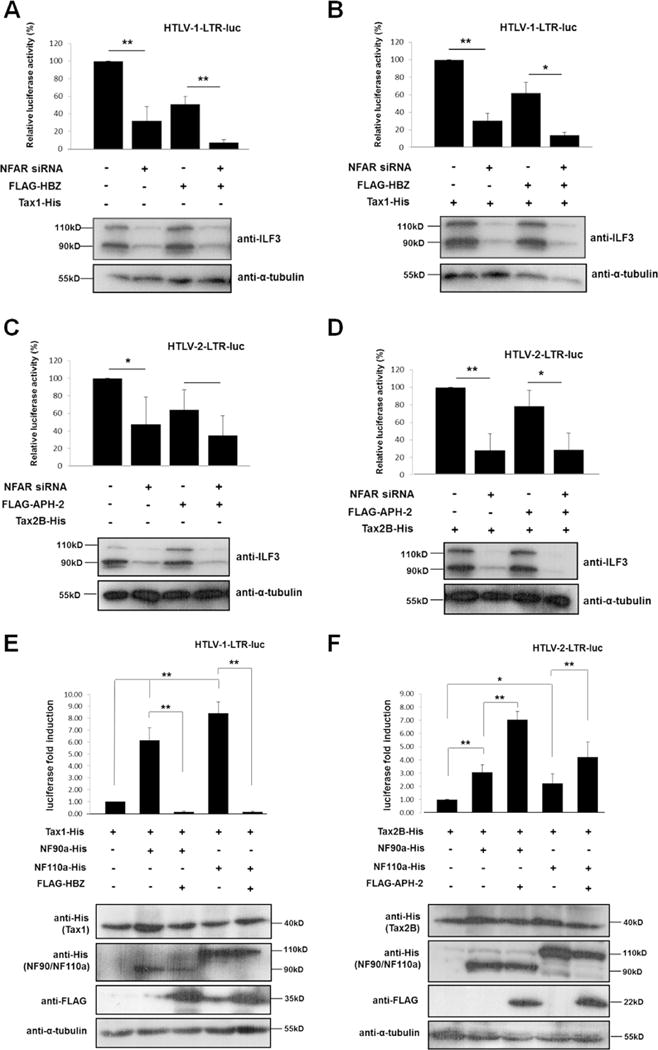
Fig. 4.

NFARs are required for HTLV-1 and HTLV-2 basal and Tax-mediated LTR activation. (A–D) Effect of NFARs on basal and Tax-mediated LTR transactivation. Approximately 40,000 HeLa cells were seeded into individual wells of 24-well cell culture dishes and transfected with 40 pmol of NFAR-specific or control siRNA. 24 h post-siRNA transfection, HeLa cells were co-transfected with 100 ng HTLV-1 or HTLV-2 LTR luciferase reporter constructs, 20 ng pCAGGS-Tax1 or -Tax2B, and 50 ng pFLAG-HBZ or -APH-2 as indicated. Luciferase assays were performed on lysates 72 hours post-siRNA transfection and were normalised against protein concentration. The average of three independent experiments is shown. Results are plotted as percentage luciferase activation relative to the control, which was assigned the arbitrary value of 100%. Error bars represent standard deviation. Asterisk (*) or (**) indicates statistical significance of p = <0.05 or p = <0.01 respectively obtained by two-tailed Student’s t-test. Shown beneath is NFAR knockdown and α-tubulin expression in cells used in luciferase assays assessed by subjecting normalised cellular lysates to western blot analysis using anti-ILF3 and anti-α-tubulin antibodies. (E–F) Effect of NF90/NF110 ectopic expression on HTLV-1 and HTLV-2 LTR transactivation. 293T cells seeded into individual wells of 6-well cell culture dishes were co-transfected with 500 ng HTLV-1 or HTLV-2 LTR luciferase reporters, 100 ng pCAGGS-Tax1 or -Tax2B, 2 μg pcDNA3.1-NF90a or -NF110a and 3 μg FLAG-HBZ or -APH-2 as indicated. Luciferase activities were measured 48 h post-transfection and normalised against protein concentration. The average of three independent experiments is shown and values are expressed as fold luciferase change relative to the control which was assigned the arbitrary value of 1. Error bars represent the standard deviation. Asterisk (*) or (**) indicates statistical significance of p = <0.05 or p = <0.01 respectively obtained by two-tailed Student’s t-test. Levels of NF90a, NF110a, Tax1, Tax2B, HBZ, APH-2 and α-tubulin expression in the cellular lysates used in the luciferases assays was determined by western blot analysis and are shown beneath.
