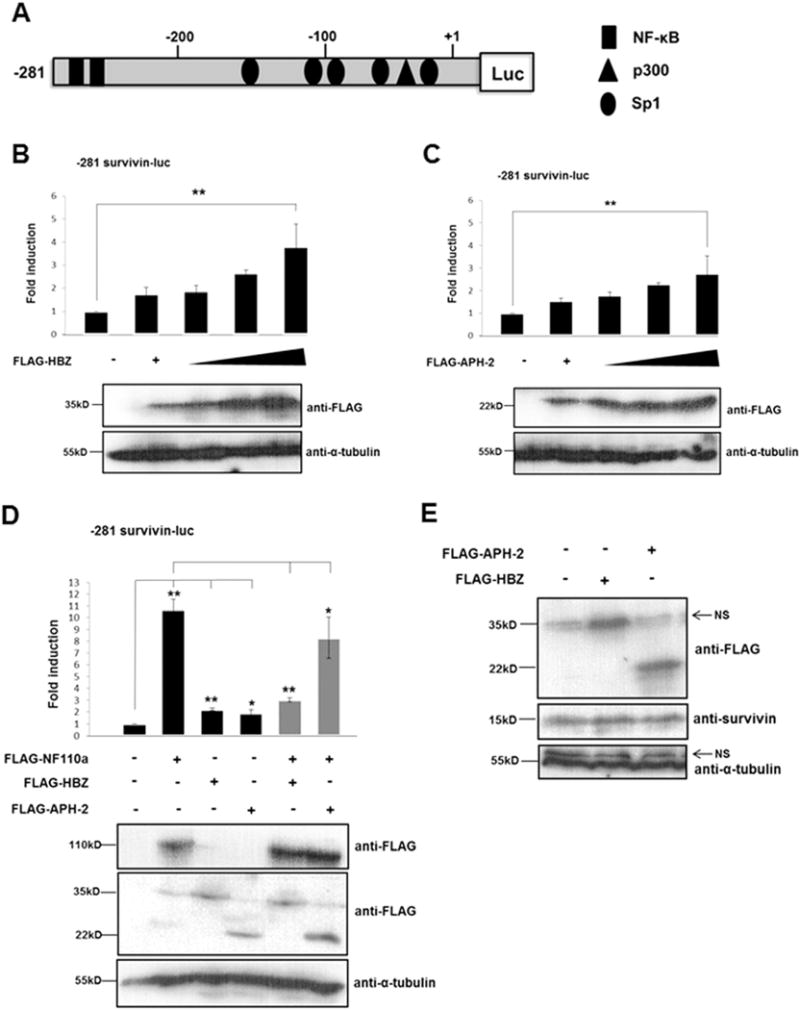
Fig. 6.

HTLV-1 HBZ and HTLV-2 APH-2 regulate survivin gene expression. (A) Schematic representation of the survivin promoter luciferase reporter constructs used in (B–D). This shows the approximate location of Sp1, NF-κB and p300 transcription factors adapted from (Kawakami et al., 2005; Banerjee et al., 2008; Mityaev et al., 2008). (B–C) HBZ and APH-2 regulate survivin promoter activity. 293T cells were co-transfected with pLuc-Hsp-281 to +30 survivin promoter luciferase reporter constructs and increasing amounts of pFLAG-HBZ or pFLAG-APH-2 as indicated. Luciferase assays were performed on cellular lysates 48 h post-transfection. Data are represented as the fold change survivin induction relative to the control, which was assigned the arbitrary value of 1. The average of three independent experiments ± standard deviation is shown. Asterisk (**) indicates statistical significance at a level of p < 0.01 obtained by two-tailed Student’s t-test. (D) HBZ and APH-2 inhibit NF110a-mediated survivin promoter transactivation. 293 T cells were cotransfected with pLuc-Hsp-281 to +30 survivin promoter luciferase reporter constructs and FLAG-NF110a, FLAG-HBZ or FLAG-APH-2 expression constructs as indicated. Luciferase assays were performed as in (B–C). The average of three independent experiments 7 standard deviation is shown. Results are represented as the fold change survivin induction relative to the control, which was assigned the arbitrary value of 1. The asterisk (*) or (**) indicates statistical significance at a level of p < 0.05 or p < 0.01, respectively obtained using a two-tailed Student’s t-test. (D) HBZ and APH-2 promote survivin protein expression. 293T cells were seeded into individual wells of a 6-well cell culture dish and transfected with 5 μg of pFLAG-HBZ or pFLAG-APH-2. 48 hours post-transfection the cellular lysates were prepared using RIPA buffer containing 50 mM Tris–HCl, 150 mM NaCl, 1% Triton® X-100, 0.1% SDS, 0.5% sodium deoxycholate. Total protein levels in the lysates were measured using a BCA assay. Equal amounts of the whole cell extracts were electrophoresed on 12% and 15% polyacrylamide gels, followed by immunoblot using anti-FLAG, anti-survivin and anti-tubulin antibodies.
