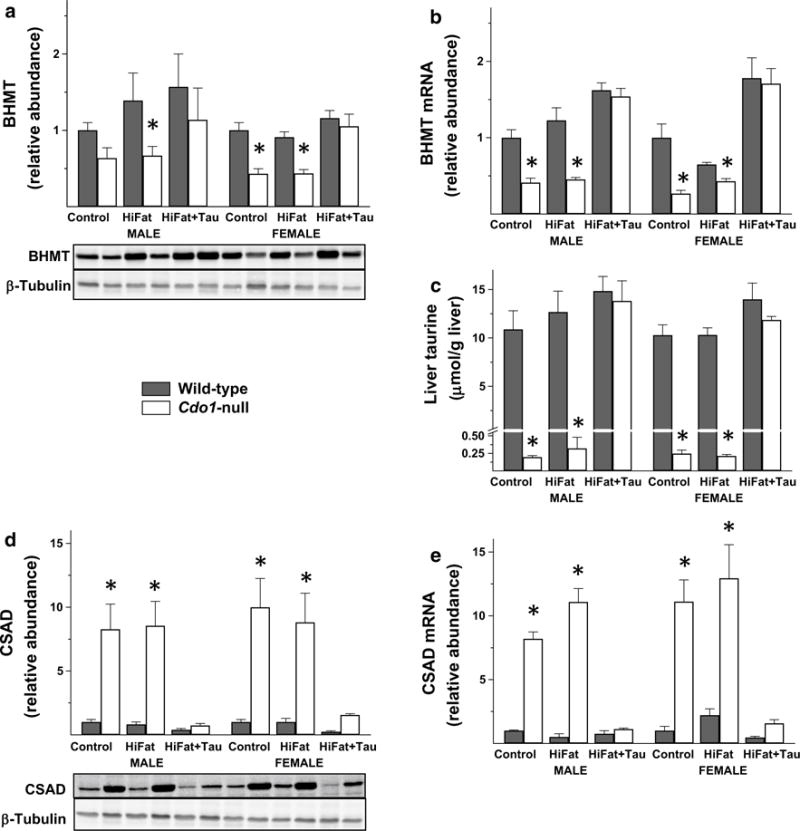
Fig. 1.

BHMT protein abundance (a), BHMT mRNA abundance (b), taurine level (c), CSAD protein abundance (d) and CSAD mRNA abundance (e) in liver from Cdo1-null and wild-type mice fed either a basal, high-fat, or high-fat + taurine diet. Values shown in bar graphs are mean ± SEM for six mice and are expressed as fold the value for wild-type mice of the same sex fed the basal diet; asterisk indicates the value for the Cdo1-null mice is significantly different (p < 0.05) than that for wild-type mice of the same sex and dietary treatment group based on post hoc Tukey’s comparison tests. Representative western blots are shown below the bar graphs for protein abundances
