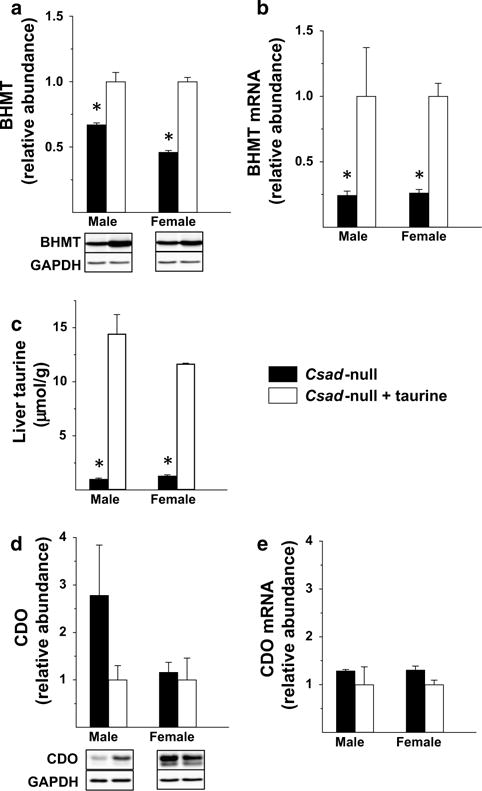
Fig. 3.

BHMT protein abundance (a), BHMT mRNA abundance (b), taurine level (c), CDO protein abundance (d) and CDO mRNA abundance (e) in liver from Csad-null mice fed either a taurine-free basal diet and supplemented without taurine or with taurine (1 g taurine per 100 mL drinking water). Values shown in bar graphs are mean ± SEM for three mice and are expressed as fold the value for taurine-supplemented mice of the same sex; asterisk indicates the value for the taurine-deficient Csad-null mice is significantly different (p < 0.05) than that for taurine-supplemented Csad-null mice of the same sex based on Student’s t test. Representative western blots are shown below the bar graphs for protein abundances
