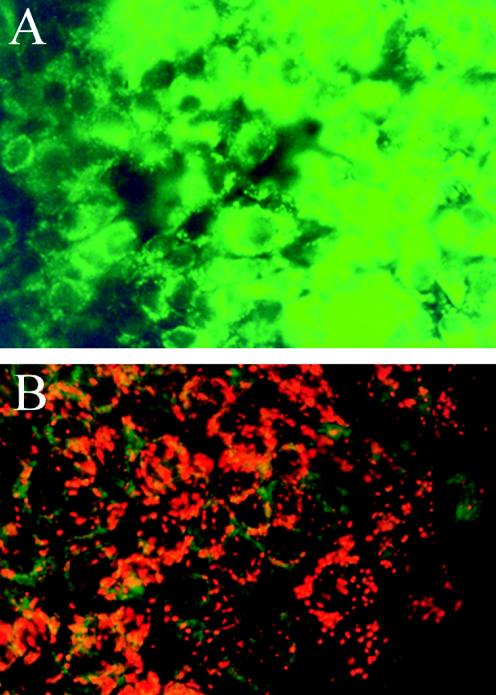
FIG. 4.
Epifluorescence micrographs of A549 cells stained with JC-1 dye to visualize the ΔΨm. A549 cells were exposed to approximately 20 μg of HPLC-purified fraction 3 (containing peptaibol components IV and V) of T. harzianum ES39 per ml for 24 h (A) and to reagents only (3.3% methanol) (B). The preserved ΔΨm is visible as orange fluorescence, and the dissipation of Δψm changes the fluorescence to green. Excitation light, 390 to 490 nm.

