
Figure 5.
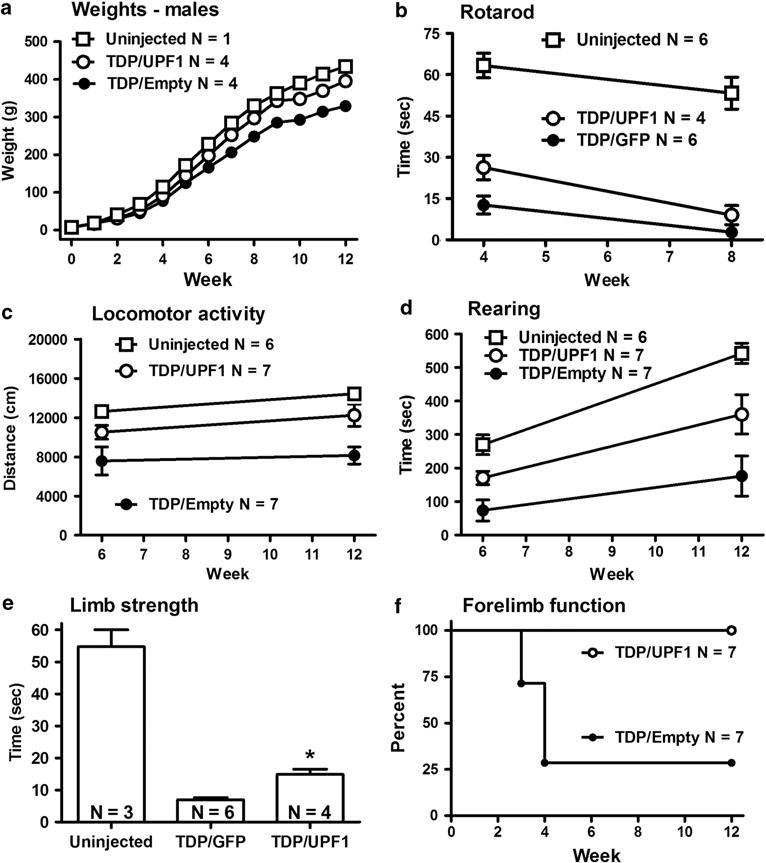
Positive outcomes exerted by AAV9 mycUPF1 compared with control vectors. (a) Weight gain curves. (b) Motor performance was assessed using rotarod assays. (c) Locomotor activity: distance traveled in 30-min test sessions. (d) Time spent rearing in 30-min test sessions. (e) Grip strength as measured by a hang test. (f) Percent of subjects with normally functional forelimbs in the escape reflex test. N values are indicated for each panel. Vector group differences between mycUPF1-treated and control groups were found in (a–f) by repeated-measures analysis of variance (ANOVA), t-test or log-rank survival analysis (P<0.05 to 0.001). See Results for details.