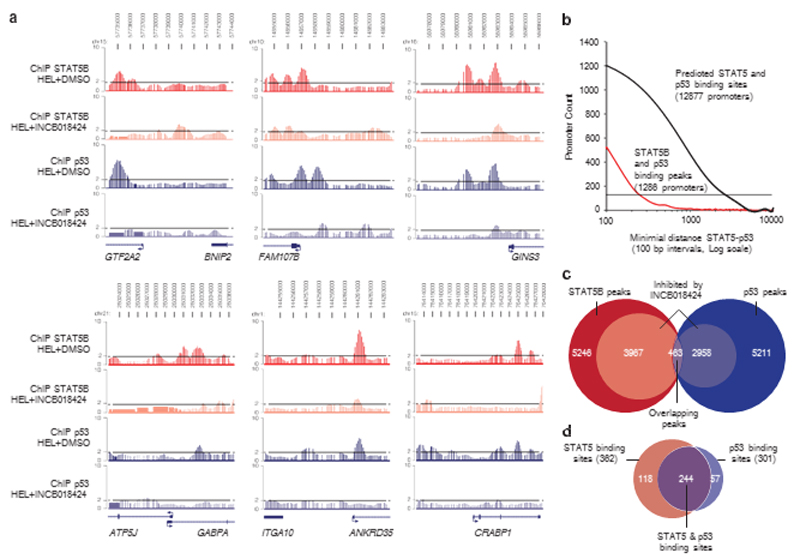
Figure 3.
STAT5B and p53 ChIP-on-chip binding peaks are frequently co-localized and dependent on STAT5B activation. (a) Enrichment levels of STAT5B or p53 chromatin immunoprecipitations from HEL cells (+DMSO) are represented in red and blue, respectively, and STAT5B and p53 enrichment levels after JAK2 inhibition (+INCB018424) are represented in pink and light blue, respectively. Dotted lines correspond to the twofold enrichment ratio compared with the input samples. (b) The number of promoters is plotted as a function of the relative distances between STAT5B- and p53-binding peaks on promoters (red line) and the relative distance between STAT5 and p53 predicted binding sites in promoters of the human genome (black line). A significant proportion of promoters contain both STAT5- and p53-binding sites within a 2.5 kb distance compared with an equiprobable distribution (dashed line) using the chi-squared test (2.2e− 16). (c) Venn diagram summarizing the total amount of STAT5B-binding peaks (red, 5246) and p53-binding peaks (blue, 5211); STAT5B peaks (3967) and p53 peaks (2958) inhibited by JAK2 inhibition are represented in pink and light blue, respectively. The intersection represents overlapping STAT5B and p53 responsive peaks (purple, 463). (d) From this list of 463 peaks, 362 (78%) contained a consensus STAT5 binding site (>85% similar to the STAT5 consensus site, in red), 301 (65%) contained a p53 consensus binding site (>70% similar to the p53 consensus site, in blue) and 244 (52%) contained both (purple). DMSO, dimethyl sulfoxide.

