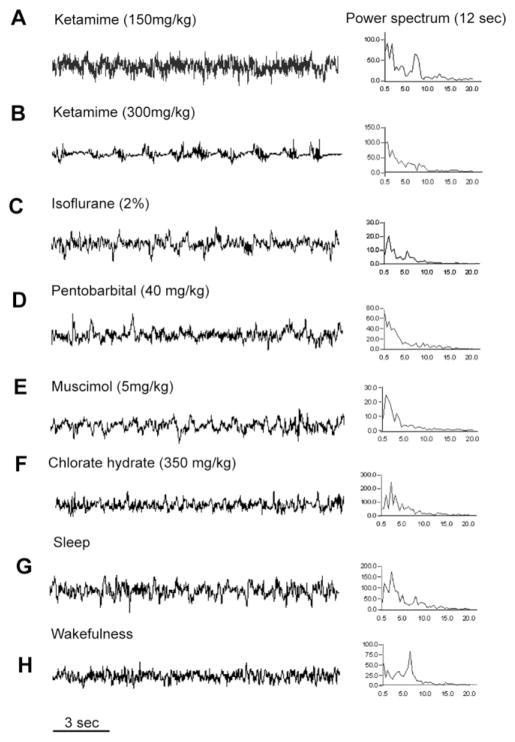
Fig. 1.
Effects on the electroencephalogram (EEG) induced by ketamine (A,B) and GABAA anesthetics (C–F), compared with normal NREM sleep (G) and wakefulness (H). For each state, a 12-second epoch of typical EEG is shown on the left, and the power spectrum for that same epoch on the right. Note that doses of ketamine up to 150 mg/kg (twice that used typically for rat anesthesia; A) increased both delta power (0.5–4.0 Hz, associated with sleep) and theta power (4–7 Hz, associated with arousal and REM sleep) in the EEG, whereas only much higher doses (300 mg/kg) predominantly increased delta power (B). All GABAA agents induced an EEG pattern dominated by slow, delta waves (C–F). The x-axis in the power spectrum represents the frequency band that was sampled, and the y-axis represents the power in that frequency band, in arbitrary units.

