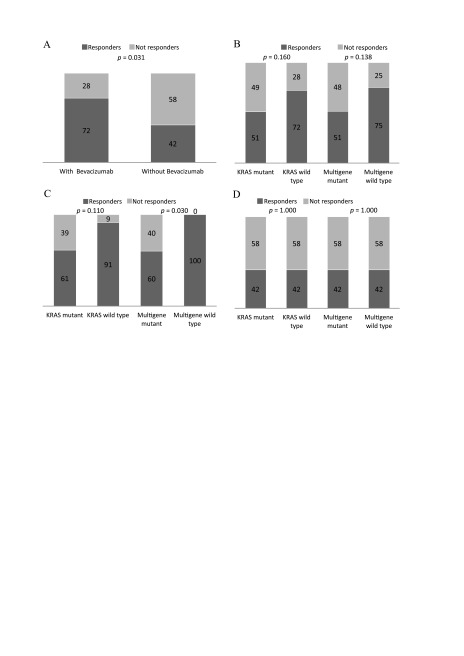
Fig 2.
Overall response rates according to the mutation status and treatment group. Response rates in all study population according to the treatment arm (A); Response rates in all study population according to the KRAS and multigene (KRAS, NRAS, BRAF, PIK3CA) mutation status (B); Response rates in the patients’ group receiving bevacizumab according to the KRAS and multigene (KRAS, NRAS, BRAF, PIK3CA) mutation status (C); Response rates in the patients’ group not receiving bevacizumab according to the KRAS and multigene (KRAS, NRAS, BRAF, PIK3CA) mutation status (A)

