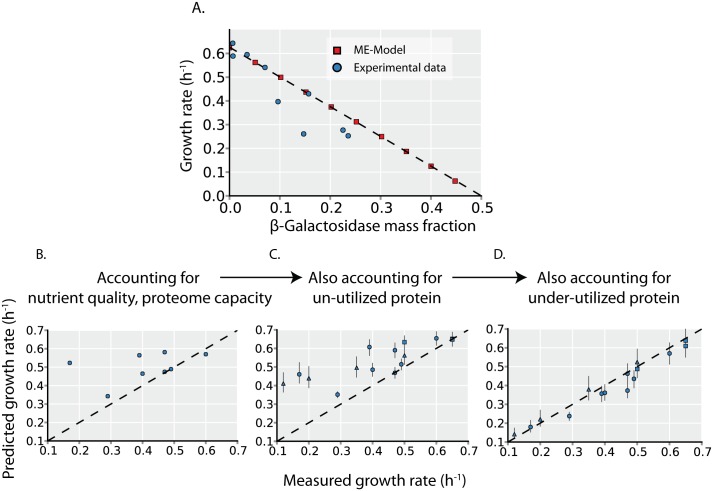
Fig 2. Growth rate is determined by unused protein expression.
(A) To validate that the ME-Model accurately quantifies protein cost, we compare the predicted effect of un-utilized protein (β-Galactosidase) overexpression (red squares) to experimental measurements (blue circles). Experimental data is obtained from Scott et al. [4] The x- and y- intercept from a linear regression (dotted line) is consistent with the phenomenological model of Scott et al. [4] The effects of the un-utilized and under-utilized protein expression (Fig 1) on growth rates are quantified in C and D. (B) Predicted growth rates are plotted versus measured growth rates during batch growth on 8 different carbon sources. Predicted growth rates are the computed maximal growth rates by the ME-Model, assuming the un-utilized proteome fraction and in vivo turnover rates are the same across all environments (see Methods, this assumption is eliminated in panels B and C to assess the effects of un- and under-utilized protein on growth). (C) Predicted maximal growth rates are computed with the ME-Model with the un-utilized proteome fraction set to the values inferred from proteomics data (see Methods and Fig 1C). In addition to the 8 carbon sources (circles), 4 glucose-limited chemostat cultures (triangles) and 4 stress conditions (squares) are also shown. These additional growth conditions are not included in panel A as growth rate predictions would require further information. (D) Predicted maximal growth rates are computed with the ME-Model with both the un-utilized proteome fraction and the in vivo turnover rate (indicative of under-utilized protein, Fig 1D) set to the values inferred from proteomics data. Point shape indicates environment type as in B (carbon source batch cultures = circles, glucose-limited chemostat cultures = triangles, stress conditions = squares).

