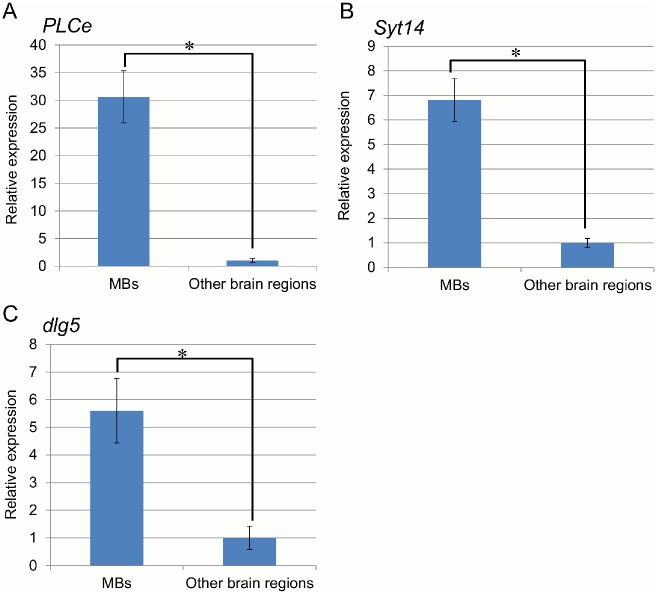
Fig 3. Quantitative RT-PCR analysis of PLCe, Syt14, and dlg5.
(A) PLCe (B) Syt14 (C) dlg5. Relative expression of each gene was normalized to RpL32 and compared between the MBs and other brain parts, taking expression in the other brain region as 1. One lot contained two workers, and four lots were used for the experiment. Bars indicate standard deviation. * indicates P < 0.01 (Welch’s t-test).

