Figure 4.

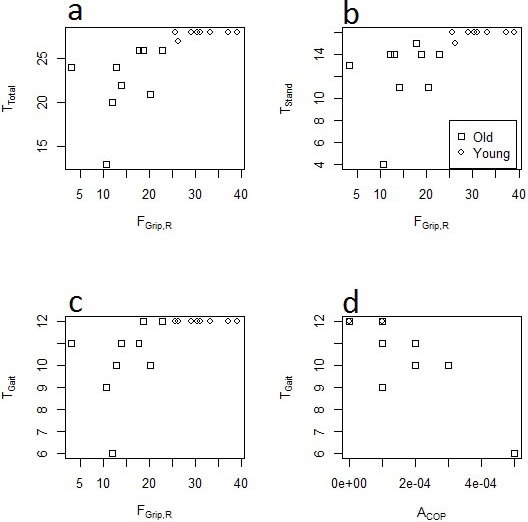
Scatter plots depicting relationships between right grip force (FGrip,R, in lb). a. overall balance score (TTotal), b. standing balance score (TStand), and c. gait score (TGait); and between d. center of pressure area (ACOP) and TGait.

Scatter plots depicting relationships between right grip force (FGrip,R, in lb). a. overall balance score (TTotal), b. standing balance score (TStand), and c. gait score (TGait); and between d. center of pressure area (ACOP) and TGait.