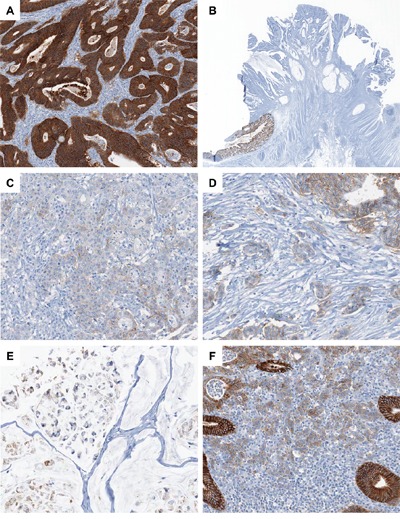
Figure 1. Photomicrographs of EPCAM IHC in CRC.

A. A representative case of EPCAM-intact MSI-high CRC (×100). Note the diffuse overexpression of EPCAM in the membrane and cytoplasm of the tumor cells. B. A representative case of EPCAM-CL MSI-high CRC (×4). Note the abrupt transition from intact EPCAM expression in the normal colonic mucosa (left lower) to the complete loss of EPCAM expression in the tumor cells (upper center). C. A representative case of EPCAM-PL MSI-high CRC (×200). Note the partial loss of EPCAM expression in the poorly formed tumor glands. D. A representative MSI-high CRC case showing partial EPCAM loss in poorly differentiated tumor cell clusters and tumor budding areas (×200). E. A representative MSI-high CRC case showing partial EPCAM loss in the signet ring cell component (×200). F. A representative MSI-high CRC case showing partial EPCAM loss in the tumor-infiltrating lymphocyte-rich invasive front area (×200).
