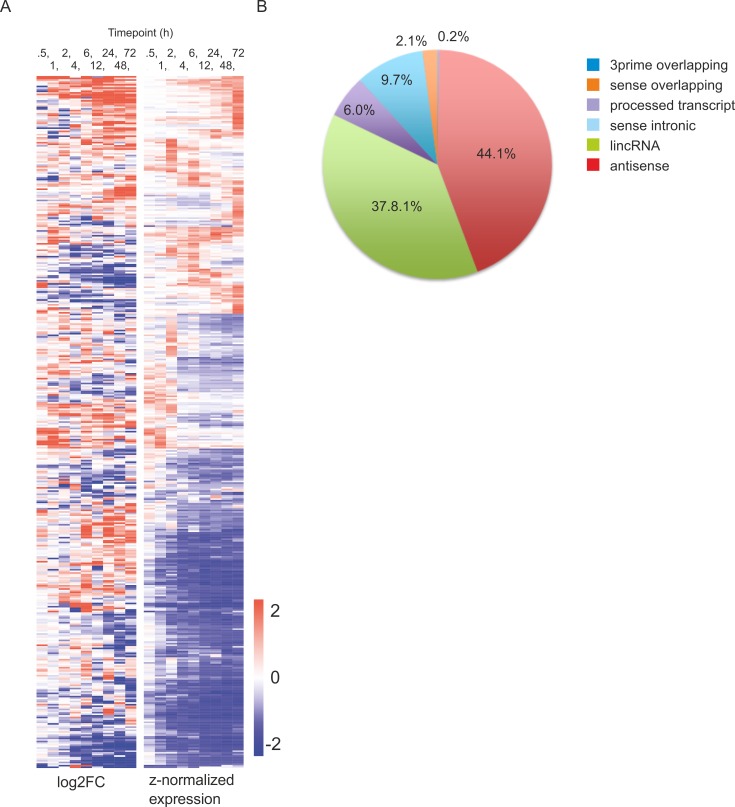
Figure 2. Differentially expressed lncRNAs during human Th17 cell priming.
A. Heatmap of the differentially expressed lncRNAs between cells polarized toward Th17 phenotype and unpolarized control cells (FDR <0.05, |log2 FC| >1 cut offs and RPKM >0.5). The lncRNAs were clustered using hierarchical clustering with Euclidean distance. B. Classification of the differentially expressed lncRNAs.

