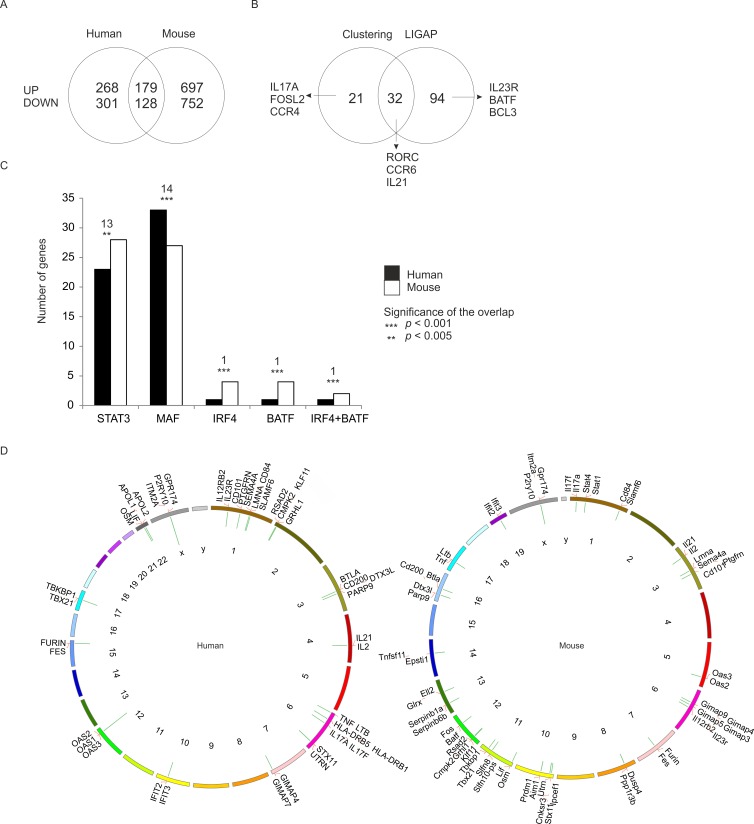
Figure 3. Shared Th17 cell-specific transcriptome in human and mouse.
Genes with FDR <0.05 were ranked based on their fold change between Th17 and Th0 conditions. The top 20% of the ranked up-regulated and down-regulated genes were included in the analysis. A. Comparison of the regulation of the orthologous genes. The similarly regulated genes had conserved regulation at least at one time point during the analyzed time frame (UP/DOWN = up- / down-regulated genes in Th17 cells). B. Comparison of the clustering and the time shift analysis results. Clustering analysis was used to select the orthologs which shared their expression profile in both species as judged by their presence in the same cluster when clustering was performed over standardized time profiles averaged at each time point across replicates. Orthologous gene pairs with similar time-shifted profiles in their Th17 cell expression were determined with an extended LIGAP method [16]. C. The number of genes predicted to be bound by STAT3, MAF, IRF4, BATF or IRF4 and BATF together based on the comparison of our data with the data by Ciofani et al. 2012 [13] with analysis window of +/−250 bp around the transcription start sites (TSS). The number of the similarly regulated genes between human and mouse that have the same binding motif is indicated above the bars with the statistical significance of the overlap. D. Genes similarly regulated in human and mouse (Table S4) were clustered based on their chromosomal location. The clusters of co-localizing genes were identified and the clusters with statistically significant (p < 0.05) co-localization visualized with the Kerfuffle tool [35] for human and mouse. The green bars protruding inward in the Circos plots indicate the identified clusters and the length of the bars represent the numbers of genes in each cluster.

