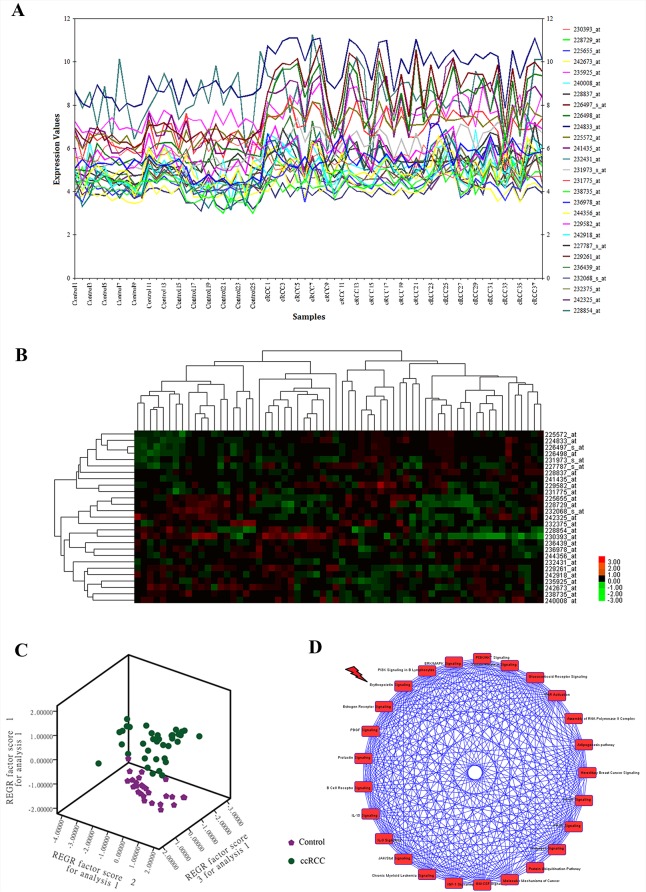
Figure 2. CcRCC gene signatures identification and signaling pathway enrichment analysis of ccRCC regulatory networks.
A. Expression plot, B. K-means hierarchical clustering and C. principal component analysis (PCA) analyses of gene signatures driven the renal carcinoma regulatory networks. D. Global canonical pathway enrichment analysis results basing on the Ingenuity Pathway Analysis (IPA) platform.

