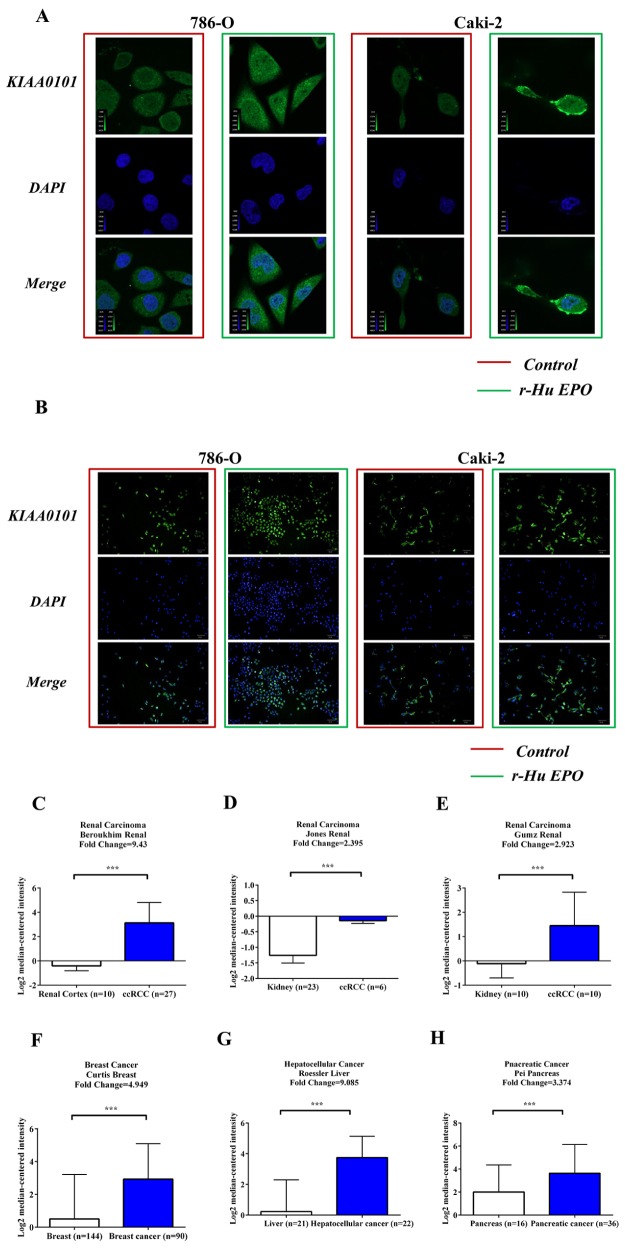
Figure 7. EPO promotes KIAA0101 expression in 786-O and Caki-2 cells and levels of KIAA0101 expression in normal tissues and primary tumors.
A. Protein levels of KIAA0101 with or without EPO treatment in 786-O and Caki-2 cell by Confocal analysis. B. Protein levels of KIAA0101 with or without EPO treatment in 786-O and Caki-2 cell by HCS. C–H. mRNA levels of KIAA0101 in normal tissue and primary tumor of renal (C-E), breast (F), liver (G) and pancreas (H) Expression levels are presented as boxplots using median ± upper/lower limits, and were compared using an unpaired Student's t test. *p < 0.05, **p < 0.01 and ***p < 0.001 compared with the normal tissue groups.

