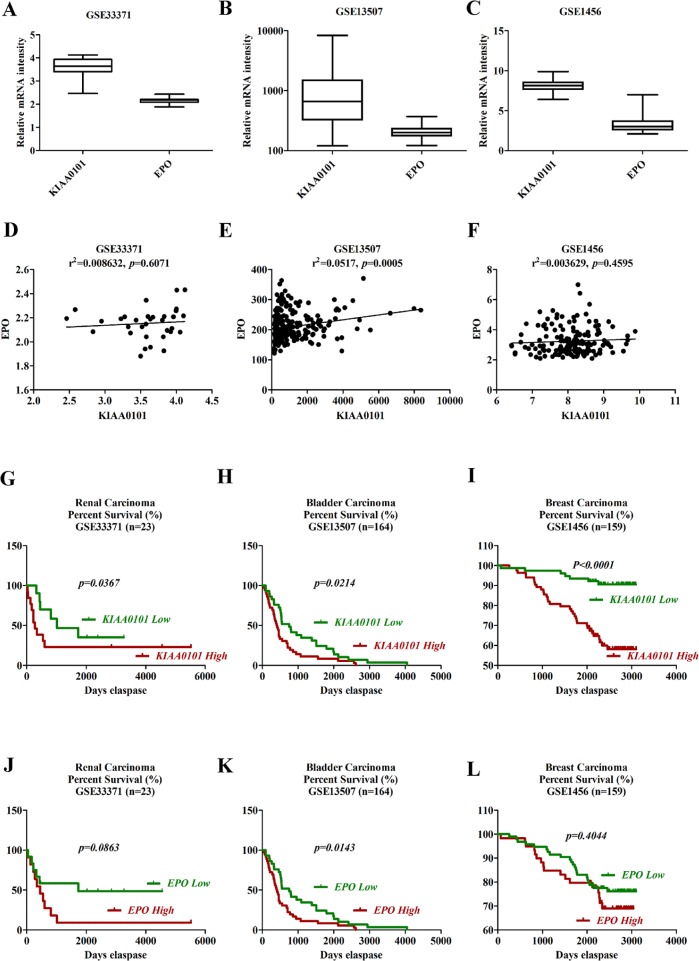
Figure 8. Survival analysis of KIAA0101 and EPO in clinical cancer samples.
A–C. Boxplots of mRNA levels of KIAA0101 and EPO in renal (A), bladder (B) and breast cancers (C) D–F. Correlation analysis of KIAA0101 and EPO expression in clinical renal (D), bladder (E) and breast (F) cancer tissues. G–I. Kaplan-Meier survival analysis of KIAA0101 in renal (G), bladder (H) and breast cancers (I) Overall survival was compared between high and low KIAA0101 expression group using a median method as the bifurcating gene expression default setting. J–L. Kaplan-Meier survival analysis of EPO in renal (J), bladder (K) and breast cancers (L) Overall survival was compared between high and low EPO expression group using a median method as the bifurcating gene expression default setting. *p < 0.05, **p < 0.01 and ***p < 0.001 for Log-rank (Mantel-Cox) Test.

