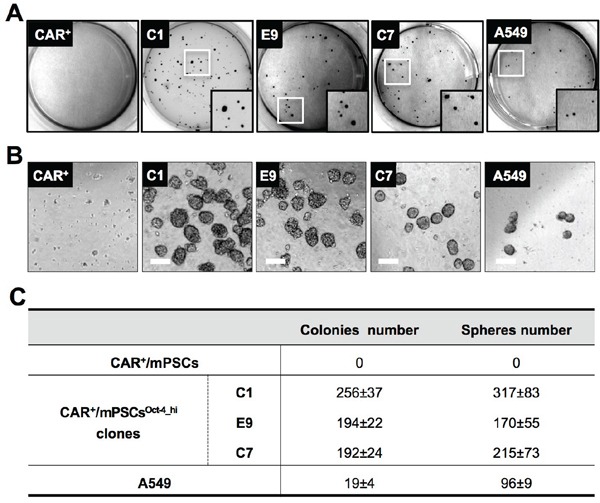
Figure 3. In vitro tumorigenic phenotype of CAR+/mPSCsOct-4_hi.

A. The soft agar colony formation assay. CAR+/mPSCs, CAR+/mPSCsOct-4_hi C1, E9, and C7 clones and A549 were subjected to soft agar culture. Colonies were photographed and quantified after 2 wk. B. Sphere formation assay. CAR+/mPSCs, CAR+/mPSCsOct-4_hi C1, E9, and C7 clones and A549 were subjected to a sphere formation assay. Secondary spheres (> 70 μm) were photographed and quantified after 10 d. (Scale bar, 100 μm.) C. Quantification of colonies and spheres. Data are presented as the mean ± SD.
