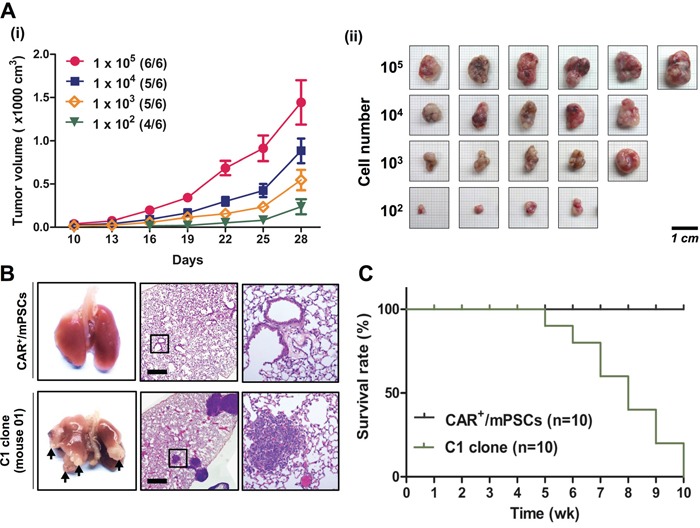
Figure 4. In vivo tumorigenic and metastatic capacities of CAR+/mPSCsOct-4_hi C1 clone.

A. In vivo xenograft tumor formation. (i), Growth curve of tumors. Different concentrations of the C1 clone (105, 104, 103, and 102 cells) were subcutaneously injected into SCID mice. Tumor diameters were measured using calipers at the indicated times after injection. Data are presented as mean ± SD. (ii), Tumors were excised, photographed, and measured at day 28 after injection. (Scale bar, 1 cm.) B. Metastatic tumor nodule formation. The C1 clone (3 × 10⁵ cells) was injected into the tail vein of SCID mice. CAR+/mPSCs were injected as a native control. Metastatic tumor nodule formation in the lung was recorded after 5 wk (indicated by arrows). H&E staining of mice injected with the C1 clone showed extensive hemorrhage and nodule formation. The magnified image of C1 clone shows nodules in lung tissue. (Scale bar, 100 μm.) C. Kaplan-Meier survival curves of CAR+/mPSCs- and C1 clone-injected mice (n = 10).
