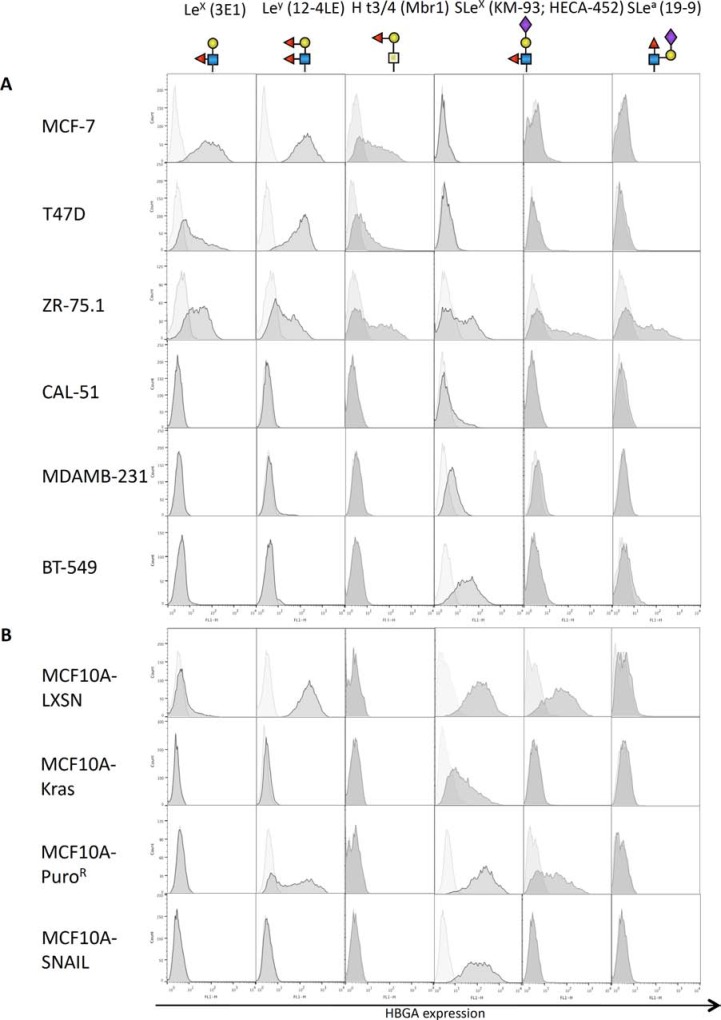
Figure 1. Expression of fucosylated antigens by mammary cell lines.
Breast cell lines from tumor origin (A) or derived from the immortalized MCF10A cell line (B) were subjected to flow cytometry using various antibodies directed against fucosylated histo-blood groups antigens, followed by an anti-mouse-FITC secondary antibody. The horizontal axis represents mean fluorescence intensity (MFI) while cell count is indicated on the vertical axis. Structures of the glycan epitopes recognized by each antibody are shown below the antibody description.

