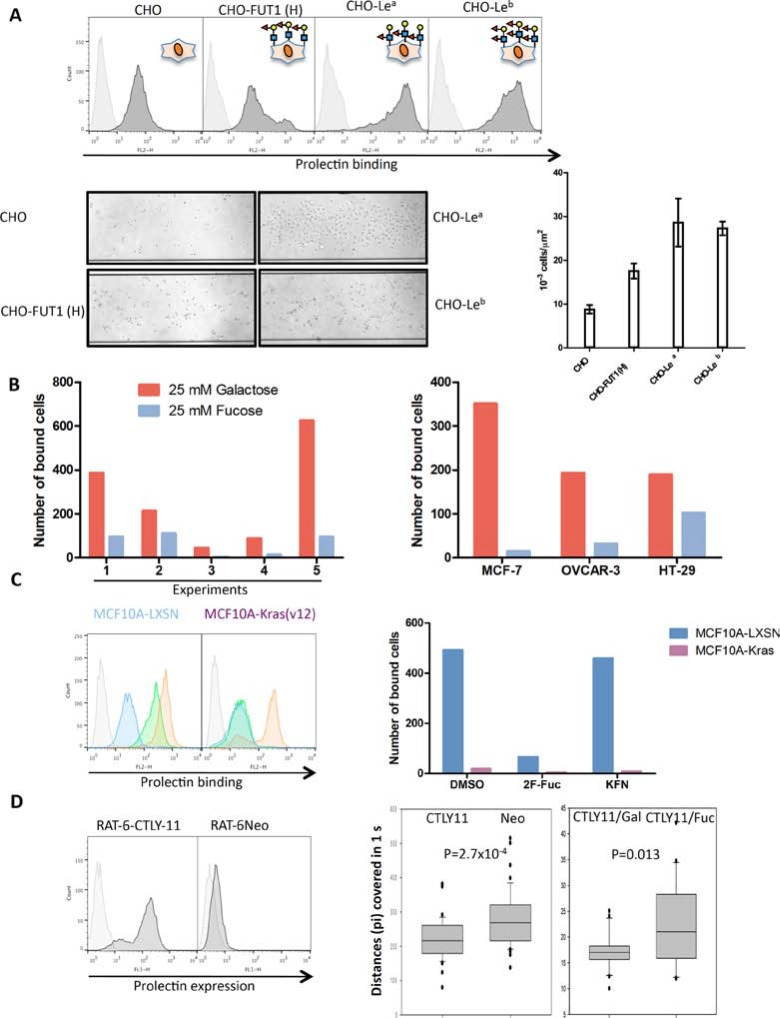
Figure 5. Prolectin acts as a cell adhesion molecule.
(A) Expression of fucosylated markers on normal CHO cells or CHO cells engineered to express fucosylated antigens tested by flow cytometry. Cells were introduced in the channels of a BioFlux microfluidic system coated with prolectin/streptavidin tetramers under a pressure of 0.1 Dyn/cm2. Unbound cells were washed away and pictures of the attached cells were taken at 10x magnification with a Leica DMI 6000B microscope. Bound cells were counted on three different segments along the channels and the mean cell densities and SEM are represented on the histogram. (B) DU-145 cells were introduced in the channels under a pressure of 0.1 Dyn/cm2 and in presence or 25 mM D-galactose or L-fucose. Unbound cells were washed away and pictures of the attached cells were taken. Bound cells were counted in the whole channels. The results of five independent experiments are shown. Due to the high variation between experiments, the results are shown separately. Similar experiments were performed with the other tumor cell lines MCF-7, OVCAR-3 and HT-29. (C) MCF10A-LXSN and MCF10A-Kras(v12) cells were treated with dimethyl sulfoxide (DMSO, green), 5 μM kifunensin (orange), or 400 μM 2F-fucose (blue) during four days and stained with prolectin by flow cytometry as described above. Control cells and cells treated with the inhibitors were injected into prolectin-coated BioFlux channels. Unbound cells were washed away and pictures of the attached cells were taken. Bound cells were counted in the whole channels. (D) Prolectin expression was tested on Rat6-Neo and Rat6-CTLY11 fibroblasts by flow cytometry. Percentages of “positive” cells are indicated. Rat6-Neo and Rat6-CTLY11 or Rat6-CTLY11 in the presence of 25 mM galactose or fucose were injected in BioFlux channels covered with a layer of DU-145 cells under a pressure of 0.05 Dyn/cm2. Films of 1 minute (600 pictures) were acquired on a Leica DMI 6000B microscope using the Metamorph software. Chronophotographic images, corresponding to 10 pictures segments of the films, were constructed using the FiJi software and distances covered by individual cells were measured. Student tests were performed to assess statistical significance.

