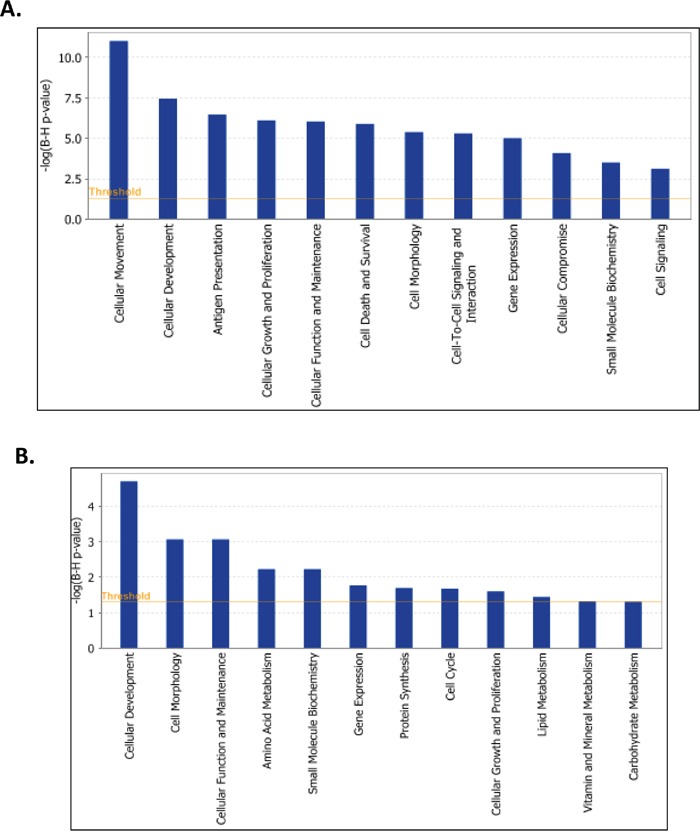
Figure 9. Functional analysis for a dataset of differentially expressed genes (≥ 2-fold) following LY75 suppression in A2780s cells.

A. Functional analysis of upregulated genes; B. Functional analysis of downregulated genes. Top functions that meet a Bonferroni-Holm multiple testing correction p-value of 0.05 are displayed.
