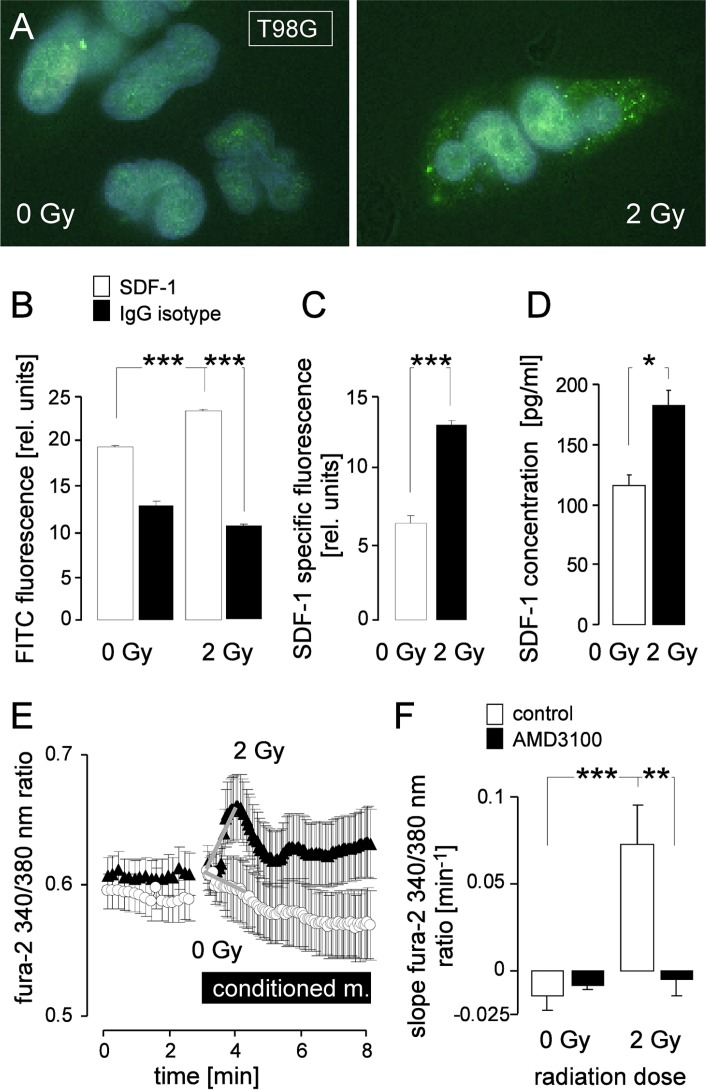
Figure 5. IR induces SDF-1 signaling of T98G cells.
(A) Immunofluorescence micrographs of 0 Gy (left) or 2 Gy (2 h after IR, right) irradiated cells stained with an anti-SDF-1 antibody and a FITC-coupled secondary antibody (green). (B) Mean (± SE) FITC fluorescence intensity of anti-SDF-1 (open bars, n = 286–364) or IgG isotype antibody-stained (closed bars, n = 42–75) cells and (C) SDF-1-specific fluorescence from 0 Gy (open bar) or 2 Gy irradiated T98G cells (closed bar). (D) Mean (± SE, n = 4) SDF-1 concentration in the medium of T98G cells 2 h after irradiaton with 0 Gy (open bar) or 2 Gy (closed bar). (E-F) CXCR4 chemokine receptor antagonist AMD3100 prevents IR-induced Ca2+ signaling. (E) Mean (± SE, n = 7–27) fura-2 340/380 nm fluorescence ratio as measure of cytosolic free [Ca2+]i recorded in T98G cells before and during superfusion with conditioned medium harvested from T98G cultures 2 h after IR with 0 Gy (open circles) or 2 Gy (closed triangles). (F) Mean (± SE) increase in free [Ca2+]i as determined by the slope (grey lines in E) of the conditioned medium-evoked rise in the 340/380 nm ratio. The conditioned media were administered without (open bars) or together with the CXCR4 antagonist AMD3100 (closed bars). *, **, and *** indicate p ≤ 0.05, p ≤ 0.01, and p ≤ 0.001, respectively, ANOVA in (B) and (F) and Welch-corrected t-test in C and (D).

