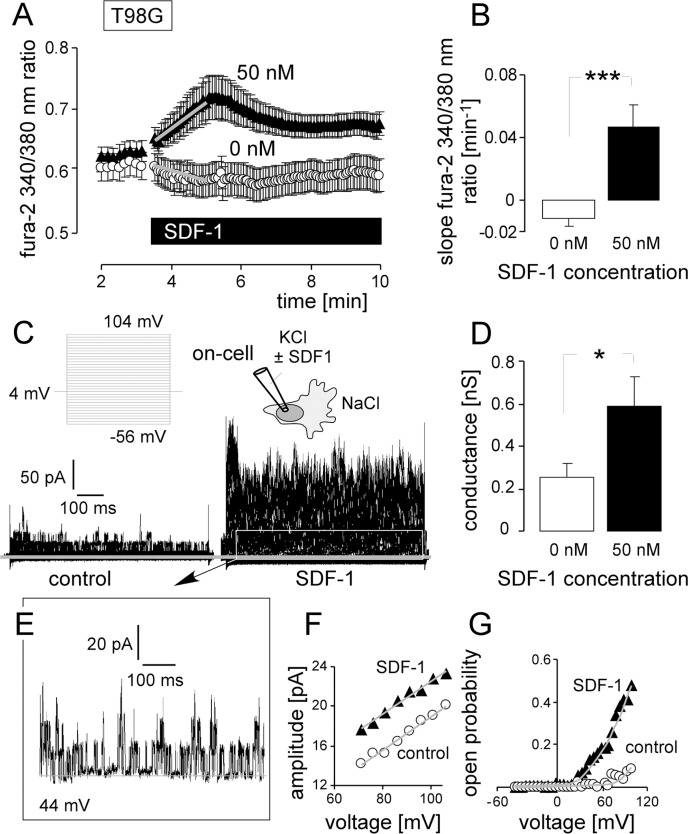
Figure 7. SDF-1 elicits Ca2+ signals and mimics the effect of IR on BK channel activity and migration in T98G cells.
(A) Mean (± SE, n = 21–36) fura-2 340/380 nm fluorescence ratio before and during superfusion with SDF-1 or control solution. (B) Mean (± SE) change in free [Ca2+]i as determined by the slope (grey lines in A) of the SDF-1- or control solution-evoked change in the 340/380 nm ratio. (C) On-cell current tracings recorded with KCl pipette- and NaCl bath solution from a control (left) and SDF-1-stimulated T98G cell (right). (D) Mean (± SE; n = 11) conductance of the clamped membrane patch as calculated from (C) for the outward currents. (E-G) Single channel current transitions (E) and dependence of the current amplitude on voltage (F) and open probability (G) of the control (open circles) and SDF-1-stimulated current tracings (closed triangles) shown in (C). * and *** indicate p ≤ 0.05 and 0.001, Welch-corrected t-test, respectively.

